OMXS30 trade ideas

OMX30 - DailyAs expected, we bounced up and re-tested the Fib 50% zone of the second leg of the last week's drop. I expect the first days of this week to offer more movement south, and with a close below 1400, we might go down and re-test the previous bottom at 1260. The price will tell us whether or nor this is the bottom or if we will follow the 2008 scenario and go lower for the coming weeks.
On the upside, it looks unlikely that we would break the 1500 resistance but assume the US could surprise us with some great news that would fuel the global markets. However, my view is still that we should build another leg on the downside with a first target close to the 1260 zone.


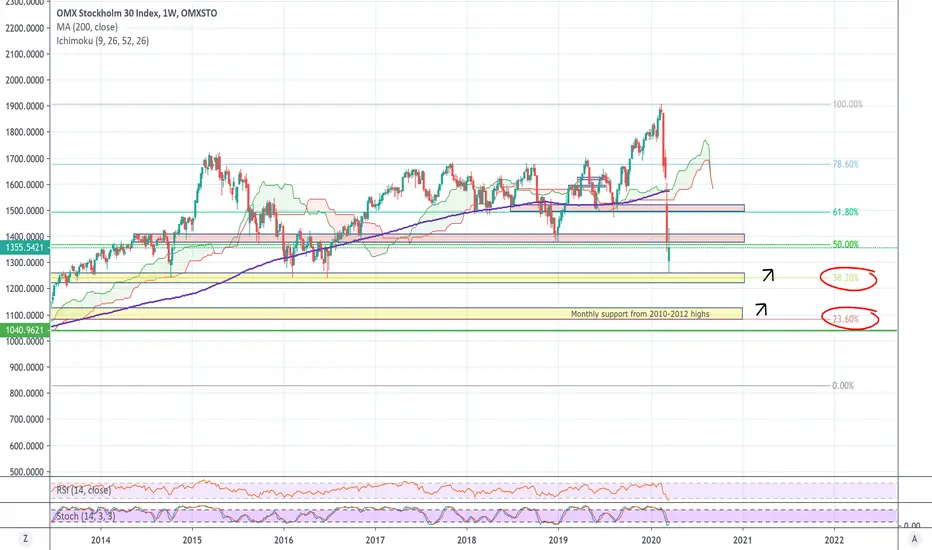
The crash was no surprise and here´s why!....But where to go?The RISING WEDGE IS A FACT!!
The market smashed into the roof and is now holding on to dear life at the support level.
Was the fast crash connect to Corona? Yes, BUT it was not until we reached the roof that the market went into reverse mood, and that faster than ever!
So where do we go from now?
We should most likely see:
A: Sideways movement due to the insecurities of the virus and the impact it has in some segments at the 1,6 fibb level and thus break the rising wedge formation
B: Additional 20% decline to the 3,2 fibb level which would mean the total decline is approx 55% in total which is in the magnitude of 2007/2008 colapse.
If I were to bet on something its option A!
Share your thoughts and like if you agree!


OMX30 - WeeklyAs expected, OMX30 made a lower low followed by an attempt up toward 1500 (Fib 50%) and failed. Still negative around the 1300 level and am expecting a drop to 1250-1200 before we see a strong reversal pattern.
OMX - DailyLooking for a light bounce up to Fib 38-50% before heading south for the last leg before building a bottom. Looking to build a short position but remain neutral for 1-2 days.

OMX30 - WeeklyLevels I'm looking at for the coming week. Minor positive divergences on daily RSI and Cycle but still no change on weekly. Expect the coming week to be volatile with a new weekly low. Like last week, expecting SP500 to be the leading index. Still negative and will look to make short entries.

OMXS30Dags att hitta ett stöd?
Lite Gann teorier igen:
SW diagonalen 1225
Basinst. 1720 : 1223
Basinst. 1548: 1234,1214
Senaste topp: 1235.1214
Daginst. 361=20/3 och 360= en cirkel. Så runt dessa datum kanske det händer något?????

Massive support levels under usI predict a bounce back and then a recoil back down to then keep on going up.


Staying short for final secondary trend cWe broke down the previous count, invalidating the expected 5th wave start. The ABC pattern is still in play though!
When shifting the trends around it looks like we have a bit more on the downside before the bulls can come back. With this count, I would expect a bottom formation between 1575 (fib 61.8) and 1600 (1592 at c=a). Note that the possibility for a flat c might make us turn quickly.
I do expect the Stocastic Slow to dip down under 20 on a weekly basis before a proper turn around.
Staying short for now but with tighter stop loss and shorter (in time) trades.

Looking for ABC to finish larger wave 4 before starting C5In the last week there have been very large movements on the world indices. It seems the larger waves are coming in more quickly than expected.
Currently looking for a flat ABC and hop to trade the C wave.
After C is complete and does not break 1700 we should be good to go another 15-20% to reach C5.

Last cycle wave 5 about to startShort timeframe
Looking to complete ABC pullback for larger wave 4 that should stay above ~1700. If the C does not gap down it should be tradable.
Intermediate timeframe
After larger wave 4 is completed I'm preparing to be bullish and look to build aggressive long positions.
Longer timeframe
After C5 is completed, a larger pullback is expected. Planning to move long portfolios to safe positions.

OMX SHORTThis is my thoughts.
We have reached an historic high and a recoil is natural. Now with the corona virus spreading worries OMX has landed at a in my opinion natural level.
What worries me is if we are to break the mid term trend. If that happens we will have a consolidation period that rapidly ends up in a "crash" down to former levels.
This can we take advantage of. I would enter a sell order if the consolidation confirms the down going trend.
-------
We are at a point where a positive recoil can occur as well so I wouldn't blindly count on a break down.
-------
This is not a recommendation, but rather my speculations and personal thoughts.
You should always make your own analysis before buying any stock.
Do you have similar thoughts about OMX? Please comment or give the analysis a like.
Good luck!


Stockholm OMXS30 bull scenarioWe've been on a very steep incline on OMXS30 since August but still seems to have some fuel left.
Looking forward to breaking 1800 in December

LONG TERM ANALYSIS OF OMXS30THIS IS MY VIEW OF IT.
Counted the waves by the elliot principle and got this results. the bull move isn't over yet if you ask me.
GOOD LUCK, THIS IS NOT AN INVESTMENT ADVICE

Omx this coming daysmy map and calculation recording to elliot wave this last trading days of this year. good luck take care!
NOT AN INVESTING ADVICE.

oms30 målmin tanke kring omxs30 är att vi ska nå kring 1850 innan nedgång på cirka 200punkter.
lycka till!
ej ett investerings tips.

OMX30 Going for the end of wave 5Hey guys, as you see we see a long term chart. we are on the last wave 5 for a top at 2020 around 1870. Then we should see an retrace back to 1364.
This is my long term analysis of OMX30.
Please leave a comment
THIS IS NOT AN INVESTING ADVICE.


OMX_30 (STOCKHOLM) ; 10TH NOV 2019US-CHINA trade optimism boosting the world’s wide stock market. OMX_30 is not also exceptional. But we have seen a lot of time, every December stock market rush into profit-taking. So we can expect some seasonal profit-taking ahead of charismas and 31st events.
If we see the chart closely, a rising channel from 2000 and 2016 is capped by right now. Every time the market falls back from this rising channel. So 1771 to 1800 will play as a critical swing zone for OMX_30. Initial support is at 1700 and a good place to rebound. If the market hold below 1700 than the primary target is 1647.67. Breaking below 1647.67 open the door for 1588.
If US-CHINA reaches to phase 2 deal than it is really tough to break out in 1588 than the market will rebounds from 1588 to 1700 to 1750-1.1777 again. On the other hand, if the US-CHINA deal is unable to reach to phase 2 deal than something bad will happen to omx30. Than omx30 may break below 1588 and the next target will be 1495 and finally, 1400 to 1405 is our final target.
www. forexpundit . com
