ONDOUSDT 1DONDO ~ 1D Analysis
#ONDO Bullish Pennant is formed on Time Frame 1D. The best way to wait until this pattern is successful broken and buy.
ONDOUSDT.P trade ideas

TradeCityPro | ONDOUSDT Good Opportunity to Buy👋 Welcome to TradeCityPro Channel!
Let's go together to analyze and review one of my favorite projects that I plan to put in my spot portfolio and find its entry points together
🌐 Overview Bitcoin
Before starting the analysis, I want to remind you again that we moved the Bitcoin analysis section from the analysis section to a separate analysis at your request, so that we can discuss the status of Bitcoin in more detail every day and analyze its charts and dominances together.
This is the general analysis of Bitcoin dominance, which we promised you in the analysis to analyze separately and analyze it for you in longer time frames.
📊 Weekly Timeframe
In the weekly timeframe, it is one of the coins that has still managed to hold itself bullish and in the declines, its recent corrections have not yet fallen below the support of 1.2110, which is a good sign.
Also, it has corrected only two weeks after its listing and after the breakdown of the listed price, it has experienced a good move and Sharpe, which is also a good sign for this coin and this event has also caused a trend to form on this coin.
This upward trend, which we recently reacted to again, can help us a lot in the future, both in terms of reaction to it and in case of a breakdown of the trend line itself and any of the triggers on the chart can be a timely exit trigger for us in relation to the time of the breakdown.
To re-enter, we ourselves entered with a breakdown of 0.8456 and bought. For now, we continue to hold it. Our more reliable trigger is the breakdown of 2.0675. There is a risk trigger, let's also set a stop-buy with our previous weekly candle shadow and make our purchase with a stop loss of 0.8456
📅 Daily Timeframe
In the daily time frame, we are really in a better situation than the rest of the altcoins and we are fluctuating at a higher bottom than the rest of them, which still encourages me to be more bullish
The candle a few days ago that caused a drop in all altcoins led to a green candle and strong buyers' pressure in this coin, and it did not care about the corrections of a few days and it is in its range box
I myself will enter after the 1.6110 break and it is likely that the 2.0833 break will be sharp, so I will try to have a long futures position trigger or buy with this level, and with the ath trigger failure, I will simply raise my entry point and do nothing below 0.5683 for now I don't give
📝 Final Thoughts
Stay calm, trade wisely, and let's capture the market's best opportunities!
This analysis reflects our opinions and is not financial advice.
Share your thoughts in the comments, and don’t forget to share this analysis with your friends! ❤️

$ONDO mechanism for BlackRock tokenizationYou know how optimistic we are about tokenizing real world assets and ONDO is one of the projects for tokenization. The most influential investment fund BlackRock is an investor in ONDO and is ready to tokenize its assets. My minimum forecast for the foreseeable future is $3.45. Buckle up!
Horban Brothers.

ONDO looks bullish (8H)ONDO seems to be in a complex correction.
As long as the green zone holds, it can move upward. The target could be the red box or even the hunt-in box.
A daily candle closing below the invalidation level will invalidate this analysis
invalidation level: 1.19$
For risk management, please don't forget stop loss and capital management
Comment if you have any questions
Thank You

ONDO Ready to Explode? Bulls Pushing for a Major Breakout!Yello, Paradisers! While most altcoins are struggling, #ONDOUSDT is showing incredible strength despite the ongoing market correction. But the big question is—can it break through resistance and rally higher? Let’s break it down!
💎#ONDO is currently forming what looks like an ascending triangle, a bullish pattern that signals a potential breakout. The price has been steadily climbing, but bulls now face a decisive resistance at $1.55–$1.60. This level is the neckline of the pattern, meaning a strong breakout here could send prices flying toward higher targets.
💎If ONDO manages to break out with strong volume, the next strong resistance lies at $1.84–$1.90—right around the recent 52-week high. Some short-term profit-taking could happen at this level, but if bulls push through, $2.10–$2.20 becomes the next major target, which aligns with the full pattern breakout projection.
💎On the downside, ONDO has strong support levels to hold the trend. The first support sits at $1.33–$1.295, reinforced by an ascending trendline. Just below, the EMA-250 adds another layer of protection against deeper corrections. Even if sellers gain momentum, ONDO enjoys a solid strong support at $1.18–$1.12, a key demand zone capable of absorbing heavy selling pressure.
Stay sharp, Paradisers! The market doesn’t forgive emotional decisions stick to the plan and execute like a pro!
MyCryptoParadise
iFeel the success🌴

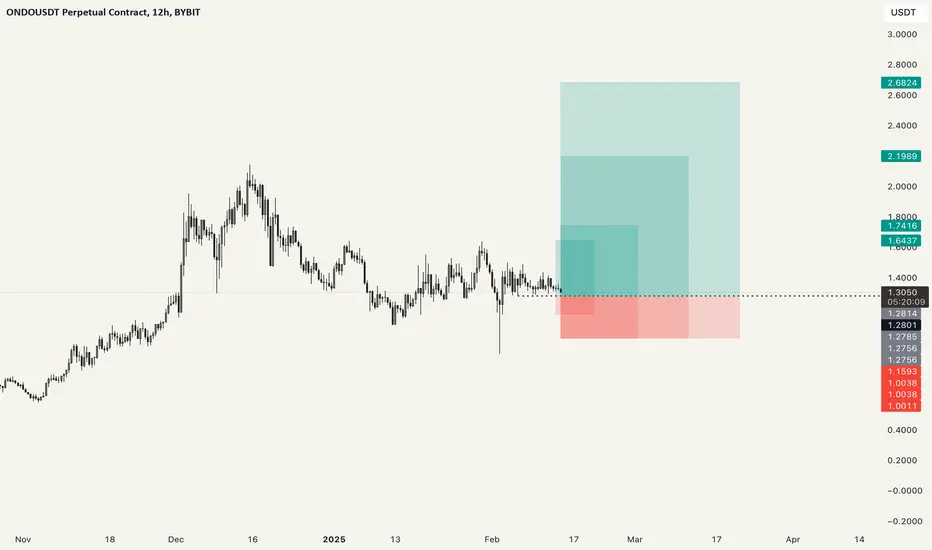
#ONDOUSDT – Key Moment: Further Drop or Reversal?BYBIT:ONDOUSDT.P is showing a bearish trend, trading below key resistance levels. The price is consolidating under $1.3010, indicating a potential continuation downward. Volume is increasing, confirming market interest. If the asset breaks below $1.2890, it could decline towards $1.2760 – $1.2723.
📉 SHORT BYBIT:ONDOUSDT.P from $1.2890
🛡 Stop Loss: $1.3010
⏱ 1H Timeframe
✅ Overview:
➡️ BYBIT:ONDOUSDT.P is testing $1.2890, with potential for a breakdown.
➡️ Rising volume suggests increased trader activity.
➡️ A breakdown below $1.2890 could push price towards $1.2760 and lower.
⚡ Plan:
➡️ Breaking below $1.2890 opens room for further downside.
➡️ Entry at $1.2890, targets at $1.2845 – $1.2723.
➡️ Partial profit-taking recommended at $1.2845 – $1.2760.
➡️ If price moves above $1.3010, the setup is invalidated.
📍 Take Profit:
🎯 TP1: $1.2845 – first target.
💎 TP2: $1.2760 – strong support level.
🚀 TP3: $1.2723 – final profit target.
📢 Bearish confirmation requires a strong close below $1.2890.
📢 If price slows at $1.2845, partial profit-taking is recommended.
📢 A breakout above $1.3010 invalidates the setup.
🚀 BYBIT:ONDOUSDT.P is on the verge of a breakdown – expecting a move to $1.2723!

ONDO - Filling the wickThis chart and crypto have been strong this season. I'm thinking it continues down trend until the final low near the bottom of the prior wick candle.
Unsure of the day, so if I want this position I may start a DCA here.
It is in in up channel, just a very large range.
Unless Alt season is cancelled and the narrative has changed, too many meme coins and other non utility crypto which dilute the market cap of each other.
Crypto total market cap can only be divided so much until many liquidate, IMO.
Not financial advice, just for a good time!
GTLA

Univers OF Signals | ONDO : Real World Asset (RWA) projectLet's quickly look at ONDO, a Real World Asset (RWA) project within the Ethereum ecosystem, currently with a market cap of $4 billion and ranked 31st in coin market cap.
🔍 In the 4-hour timeframe, we observe a large range box between $1.1285 and $1.6073, which I've marked with white lines. Inside this box, there's a smaller box ranging from $1.2520 to $1.4340, marked with dark blue.
📈 For long positions, a risky entry could be considered if the price breaks $1.4340, and the main long position would be logical if $1.6073 is broken. The target for the main long position would be $2.0434.
📉 For short positions, a risky trigger is the break of $1.2520, which could be played for short-term scalping. The main trigger for a short would be breaking $1.1285, aiming for a target at $0.92555.
📊 Market volume has significantly decreased and is currently at its minimal possible state. If a suitable candle with higher volume activates our triggers, we can confirm the next leg of price movement.
✨ Currently, we don't have any triggers in the RSI as the market lacks momentum and since RSI is a momentum oscillator, it doesn't make sense to check it now as it might give us misleading data.

ONDO FINANCE (EXPERIMENTAL)Institutional-Grade Finance, Now Onchain.
LSE:ONDO is building the next generation of financial infrastructure to improve market efficiency, transparency, and accessibility.

ONDOUSDT 1D#ONDO has formed a bullish flag on the daily chart. If it manages to hold above the MA100, it will surely aim for a bullish breakout of the flag. In case the pattern breaks, the targets are:
🎯 $1.4595
🎯 $1.6881
🎯 $1.8728
🎯 $2.0576
🎯 $2.3206
🎯 $2.6557

ONDOUSDT Good Opportunity to BuyLet's go together to analyze and review one of my favorite projects that I plan to put in my spot portfolio and find its entry points together
🌐 Overview Bitcoin
Before starting the analysis, I want to remind you again that we moved the Bitcoin analysis section from the analysis section to a separate analysis at your request, so that we can discuss the status of Bitcoin in more detail every day and analyze its charts and dominances together.
This is the general analysis of Bitcoin dominance, which we promised you in the analysis to analyze separately and analyze it for you in longer time frames.
📊 Weekly Timeframe
In the weekly timeframe, it is one of the coins that has still managed to hold itself bullish and in the declines, its recent corrections have not yet fallen below the support of 1.2110, which is a good sign.
Also, it has corrected only two weeks after its listing and after the breakdown of the listed price, it has experienced a good move and Sharpe, which is also a good sign for this coin and this event has also caused a trend to form on this coin.
This upward trend, which we recently reacted to again, can help us a lot in the future, both in terms of reaction to it and in case of a breakdown of the trend line itself and any of the triggers on the chart can be a timely exit trigger for us in relation to the time of the breakdown.
To re-enter, we ourselves entered with a breakdown of 0.8456 and bought. For now, we continue to hold it. Our more reliable trigger is the breakdown of 2.0675. There is a risk trigger, let's also set a stop-buy with our previous weekly candle shadow and make our purchase with a stop loss of 0.8456
📅 Daily Timeframe
In the daily time frame, we are really in a better situation than the rest of the altcoins and we are fluctuating at a higher bottom than the rest of them, which still encourages me to be more bullish
The candle a few days ago that caused a drop in all altcoins led to a green candle and strong buyers' pressure in this coin, and it did not care about the corrections of a few days and it is in its range box
I myself will enter after the 1.6110 break and it is likely that the 2.0833 break will be sharp, so I will try to have a long futures position trigger or buy with this level, and with the ath trigger failure, I will simply raise my entry point and do nothing below 0.5683 for now I don't give
📝 Final Thoughts
Stay calm, trade wisely, and let's capture the market's best opportunities!
This analysis reflects our opinions and is not financial advice.
Share your thoughts in the comments, and don’t forget to share this analysis with your friends! ❤️

ONDO :: SHORT???????This analysis is solely based on the chart. Issues such as the overall market situation, the fundamentals of the currency, macroeconomics, and other parameters like traders' expectations for an altcoin season have never been taken into account. It is an analysis purely based on the chart. What I observe in this chart is that it requires a relatively deep correction. For clarity, some aspects of this analysis have been omitted. Please do not base your trades on this analysis. If such an analysis were to become reality, what do you think would happen to other cryptocurrencies? I would appreciate your constructive feedback regarding the price and its movement.

$ONDO - Main Takeaways from the ONDO SummitMain Takeaways from the ONDO Summit
The Ondo Summit 2025, held on February 6, 2025, marked a significant event for the integration of traditional finance (TradFi) with decentralized finance (DeFi) sectors. Here are the main takeaways:
Institutional Onboarding into DeFi: The summit was crucial for introducing institutional investors to DeFi, with a focus on Real World Assets (RWA) tokenization. This was highlighted by the participation of high-profile figures from traditional finance, including BlackRock's CEO Larry Fink, indicating serious institutional interest in DeFi.
Ondo Chain: Ondo Finance announced the launch of its own blockchain, Ondo Chain, aimed at scaling assetization and merging TradFi with DeFi. This signifies a big step towards bringing traditional financial assets onto blockchain platforms.
Ondo Global Markets: The introduction of Ondo Global Markets was to facilitate tokenization of stocks, bonds, ETFs, and mutual funds, offering 24/7 access to these assets on-chain. This move is intended to make financial markets more accessible, transparent, and efficient.
Ondo Finance's ambition to bridge the gap between traditional and decentralized finance, potentially setting new standards for how financial assets are managed and traded in the future.
TECHNICAL OUTLOOK
ONDO is one of the most promising RWA tokens, with great potential.
With incredible strength, it's currently consolidating while the entire altcoin market is being shredded.
It's holding the $1.30 support well; however, we need to see Bitcoin holding the $96k level. Bitcoin was rejected at $100k, and there's evident buyer weakness at the current level, with a poor reaction likely due to low volume over the weekend.
Let's see if there will be a reaction at 92k; it has proven to be a strong support, though we could also deviate below it and test the lows around $89k.
If Bitcoin drops to 92k, we could see ONDO revisiting $1.20-$1.18, or it could go lower, filing its wick at $1.12-$1.08.
The worst scenario would be taking out the imbalance/excess at $1.

OndoThis is ondo weekly
I will dive in into lower time frame and look for confluence to find to a good set up

Support around 1.3814 is the key
Hello, traders.
If you "Follow", you can always get new information quickly.
Please click "Boost" as well.
Have a nice day today.
-------------------------------------
(ONDOUSDT.P 1D chart)
This volatility period is expected to continue from February 7th to 9th.
It has touched the Fibonacci ratio range of 0.236 (0.8416) ~ 0.382 (1.0298) and is rising.
Currently, the key is whether it can be supported near the MS-Signal (M-Signal on the 1D chart) indicator, near 1.3814.
If it is supported, it is expected to rise above the BW (100) indicator point of 1.4869.
-
If it is supported near 1.1255-1.2715, it is a time to buy.
If it falls below this range, you should check for support near 0.9274.
-
(1M chart)
The chart has not been created for long, so the indicator has not been formed yet.
However, if it is supported and rises around 0.5(1.1818) ~ 0.618(1.339) in terms of Fibonacci ratio,
1st: 1(1.8263)
2nd: 1.618(2.6228)
3rd: 1.902(2.9889) ~ 2(3.1152)
You should respond depending on whether there is support around the 1st-3rd above.
-
Thank you for reading to the end.
I hope you have a successful trade.
--------------------------------------------------
- Big picture
I used TradingView's INDEX chart to check the entire range of BTC.
(BTCUSD 12M chart)
Looking at the big picture, it seems to have been maintaining an upward trend following a pattern since 2015.
That is, it is a pattern that maintains a 3-year uptrend and faces a 1-year downtrend.
Accordingly, the uptrend is expected to continue until 2025.
-
(LOG chart)
As you can see from the LOG chart, the uptrend is decreasing.
Accordingly, the 46K-48K range is expected to be a very important support and resistance range from a long-term perspective.
Therefore, we expect that we will not see prices below 44K-48K in the future.
-
The Fibonacci ratio on the left is the Fibonacci ratio of the uptrend that started in 2015.
In other words, it is the Fibonacci ratio of the first wave of the uptrend.
The Fibonacci ratio on the right is the Fibonacci ratio of the uptrend that started in 2019.
Therefore, this Fibonacci ratio is expected to be used until 2026.
-
No matter what anyone says, the chart has already been created and is already moving.
How to view and respond to this is up to you.
When the ATH is updated, there are no support and resistance points, so the Fibonacci ratio can be used appropriately.
However, although the Fibonacci ratio is useful for chart analysis, it is ambiguous when used as support and resistance.
This is because the user must directly select the important selection points required to create Fibonacci.
Therefore, since it is expressed differently depending on how the user specifies the selection points, it can be useful for chart analysis, but it can be seen as ambiguous when used for trading strategies.
1st : 44234.54
2nd : 61383.23
3rd : 89126.41
101875.70-106275.10 (Overshooting)
4th : 134018.28
151166.97-157451.83 (Overshooting)
5th : 178910.15
-----------------

#ONDOUSDT expecting further upside📉 LONG BYBIT:ONDOUSDT.P from $1.4891
🛡 Stop Loss: $1.4667
✅ Overview:
➡️ BYBIT:ONDOUSDT.P is trading in a consolidation range, forming a local support level around $1.3705.
➡️ POC (Point of Control) is at $1.3631 , indicating the area with the highest trading volume.
➡️ The price has broken a resistance zone and is now testing it as support, which could be a long entry signal.
➡️ If the asset holds above $1.4048, an upward move towards the next resistance levels is likely.
⚡ Plan:
➡️ Entering a long position at $1.4891 after confirming a hold above the key level of $1.4048.
➡️ Stop-loss is set at $1.4667 , below the recent support zone.
➡️ Expecting a bullish push with a target of $1.5699.
🎯 TP Targets:
💎 TP 1: $1.5699 – the first target level where partial profit-taking is recommended.
💎 TP 2: $1.6000
📢 BYBIT:ONDOUSDT.P shows signs of potential growth, but it’s crucial to monitor the $1.4048 level – a breakdown below could lead to further decline.
📢 Volume remains at an average level, indicating possible position accumulation before a move.
📢 To confirm a strong uptrend, price must hold above $1.4891 and successfully test the $1.5699 resistance level.
🚀 BYBIT:ONDOUSDT.P is shaping a bullish scenario — expecting a breakout and further upside!

ONDO Holds 20% Monthly Gains but Struggles to Regain MomentumOndo Finance (ONDO) remains one of the top-performing Real-World Asset (RWA) tokens, holding a $4.2B market cap despite recent consolidation. The token is up 20% in 30 days but has lacked clear momentum in recent sessions.
Key Indicators Suggest Market Uncertainty:
- ADX at 10.7 – Weak trend strength, signaling continued consolidation.
- Directional Movement Index (DMI) Confirms Indecision – +DI has dropped from 24.2 to 19.7, while -DI has risen from 12.8 to 16.6, indicating fading buying pressure.
- CMF Drops from 0.1 to 0.01 – Buying pressure is weakening; a dip below zero could lead to renewed selling.
Critical Price Levels to Watch:
📌 Resistance at $1.49 – A breakout could lead to $1.66.
📌 Support at $1.28 – If broken, ONDO could decline toward $1.00.
ONDO’s EMA lines are aligned, reinforcing the lack of clear direction. Until ADX climbs above 20, ONDO may continue trading sideways.

#ONDO bought some ondo on spot, HTF wicked in to good zone, daily looks ready.
keeping risk at 1% still

ORAI vs ONDO - Both O's are Original!Straight to the point! I am seeing this in ORAI in days chart! The diagram is mentioned below. Bet it!
The OB is filled and stacked and a weeks stay, or going little bit down playing with buyers emotion is what gonna happen. Mark it! Thats what is gonna happen for ORAI!
Now, when can i get hold of this fish? Lets see.
Coming to the 4H charts, mentioned below!
you can see i have squeezed it a lot, and its just dancing on top of the trend line, as if he is made to stand on a hot pan lol.
Now going further you can see I have marked three circles, everytime when ORAI tried to go up, it fell down, or is it just a dead cat bounce people didnt interpret? Look at it carefully, tried to go up, but trapped buyers and eventually sellers were in control, the last part is what is funny, where it took sellers out and for a moment buyers gained control but eventually failed, Many would say, Sell on every rise, but not this time.
IF I consider the parallel channel as the distribution phase, then the spring is marked. Not all wyckoff cycles are same, its just how the trader beholds it. So now you know where to buy ORAI!!.
Coming to ONDO - Pretty straightforward, to buy it below the red line, buying here would nowhere take it up.

Ondo Surges 11% Amid ONDO Chain Launch and Institutional BackingOndo Finance has made headlines with the launch of Ondo Chain, a Layer 1 blockchain designed to accelerate the adoption of tokenized real-world assets (RWAs). The development has sparked significant investor interest, pushing ONDO’s price up 11% amid broader market fluctuations. With major financial institutions backing the project and recent investments pouring into ONDO, could the token be on track to reach a new all-time high (ATH)?
Ondo Chain: A Game-Changer for Tokenized Securities
On February 6, 2025, Ondo Finance announced the launch of Ondo Chain, a blockchain solution aimed at bridging traditional finance (TradFi) with decentralized finance (DeFi). The platform is set to provide compliance-focused infrastructure for institutions seeking exposure to tokenized stocks, bonds, and ETFs.
By leveraging the benefits of both public and permissioned blockchains, Ondo Chain offers institutional-grade security while maintaining the accessibility of public networks. Key features include:
- Lower transaction fees
- Improved liquidity for tokenized assets
- Regulatory compliance through permissioned validators
- Staking mechanisms for passive income generation
- Native omnichain bridging for seamless asset transfers
Several high-profile financial institutions, including Franklin Templeton, Wellington Management, and WisdomTree, have expressed support for Ondo Chain, signaling strong institutional confidence in the project.
Institutional Investment Boost: World Liberty Financial Bets Big on ONDO
One of the most notable bullish signals for ONDO came from World Liberty Financial, an investment firm backed by former U.S. President Donald Trump. On the same day as the Ondo Chain announcement, the firm purchased $470,000 worth of ONDO tokens, marking its second investment in two months.
Blockchain data reveals that World Liberty Financial previously acquired $245,000 worth of ONDO, making this latest purchase a reinforcement of its long-term commitment to the token. The firm has also accumulated assets like TRX and Wrapped Bitcoin (WBTC), showcasing a growing interest in blockchain-based financial markets.
Technical Analysis
As of the time of writing, ONDO is up 4.14%, consolidating after an 11% rally. The technical indicators suggest that ONDO is at a pivotal point:
- RSI at 50: This neutral position indicates neither overbought nor oversold conditions, leaving room for further upside if market sentiment remains bullish.
- Moving Averages (MA) Alignment: ONDO’s price movement is in sync with key moving averages. A breakout above these MAs could trigger a bullish surge toward the previous ATH.
- Fibonacci Levels: ONDO is hovering around critical Fibonacci retracement levels:
- 61.8% Fibonacci support: This serves as a strong downside cushion in case of a pullback.
- 38.2% Fibonacci resistance: A breakout above this level could fuel a rally toward ONDO’s one-month high and potentially push it beyond previous highs.
With the broader crypto market stabilizing after recent sell-offs, ONDO appears to be positioned for further gains, provided it can break key resistance levels.
Will ONDO Reach a New ATH?
Ondo Finance’s recent developments, coupled with strong institutional backing, set the stage for ONDO to potentially hit new highs. The launch of Ondo Chain addresses key inefficiencies in tokenized finance, making it an attractive proposition for institutional players. Additionally, technical indicators suggest that ONDO is at a crucial inflection point, with a breakout above key levels potentially driving a bullish continuation.

ONDO - The Sweet Spot!Hello TradingView Family / Fellow Traders. This is Richard, also known as theSignalyst.
📈After rejecting the $2 round number, ONDO has been in a correction phase and it is currently approaching the lower bound of its rising broadening wedge marked in blue.
Moreover, the green zone is a strong support and round number $1.
🏹 Thus, the highlighted blue circle is a strong area to look for buy setups as it is the intersection of the $1 round number and lower blue trendline acting as a non-horizontal support.
📚 As per my trading style:
As #ONDO approaches the blue circle, I will be looking for bullish reversal setups (like a double bottom pattern, trendline break , and so on...)
📚 Always follow your trading plan regarding entry, risk management, and trade management.
Good luck!
All Strategies Are Good; If Managed Properly!
~Rich

