ONDO/USDT 2D – Falling Wedge Breakout in Play?ONDO/USDT is currently forming a highly compelling structure on the 2-day timeframe. Price action suggests a possible breakout from a falling wedge pattern, which is typically a bullish reversal signal.
🔹 Strong Support Zone:
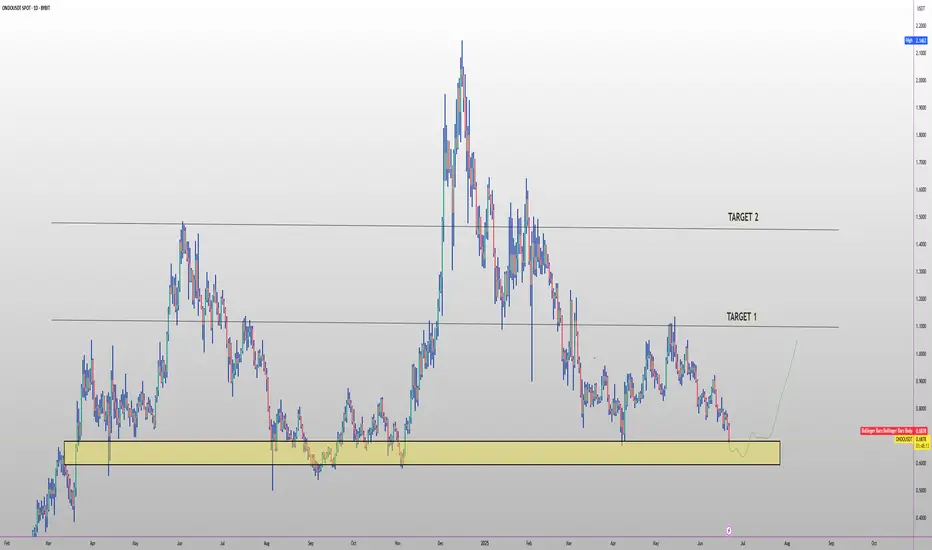
The price continues to respect a significant accumulation zone between 0.65 – 0.73 USDT, which has held as a major support area since September 2023. Multiple successful retests reinforce its strength.
🔹 Descending Trendline Breakout:
The descending resistance line (yellow trendline), connecting lower highs since December 2023, is being tested and appears to be breaking. A confirmed breakout could trigger a strong bullish reversal.
🔹 Potential Upside Targets (Based on Structure and Fibonacci Projections):
TP1: 0.81211 (breakout confirmation level)
TP2: 1.13111 (key horizontal resistance)
TP3: 1.56596 (technical extension zone)
TP4: 2.04123 – 2.14522 (major historical resistance and previous swing high)
🔹 Trade Idea:
Conservative Entry: Buy the retest near 0.73–0.75 USDT after breakout confirmation
Stop Loss: Below the key support zone, around 0.65 USDT
Risk to Reward: Very favorable, with upside potential exceeding +160%
🔹 Confirmation Tips:
Look for a clean breakout with increased volume and a candle body closing above the trendline. A breakout + retest scenario provides higher probability for trend continuation.
ONDOUSDT trade ideas

ONDOUSDT – POTENTIAL BREAKOUT TRADE SETUP!Hey Traders — if you're into high-conviction setups with real momentum, this one’s for you.
ONDO is trading inside a falling wedge on the daily chart — a classic bullish structure that often leads to explosive breakouts. 📈
Accumulation Zone: Price is currently sitting inside the green support box, which has held strong multiple times. This makes it a good area to start accumulating before a potential breakout.
🚀 Breakout not confirmed yet, but structure looks promising. A breakout above the wedge will be the confirmation trigger.
📌 Trade Setup:
✅ Entry (Spot Accumulation): $0.73–$0.78
🎯 Targets after breakout: $1.10 / $1.45 / $2.05
🛑 Stop-loss: $0.58
📈 Bias: Bullish on breakout
🔸 Monitor for a clean breakout candle + volume above the wedge.
🔸 Manage position sizing while accumulating in the zone.
Let’s see if history repeats and ONDO gives us a strong breakout move.

Ondo Finance: 290%, 483% & 676% Summer & FallBullish momentum right now is building up so fast that I can hardly share a chart before prices are up 5 to 10%. If you try to buy, prices can runaway from you specially when using leverage. That's what I mean when I say that the bottom, bottom prices, will only last a few days at max. The time is now.
Here we have Ondo Finance with a great pattern, the ascending channel. This chart structure clearly reveals a very strong, long-term bullish bias. And the logical conclusion is always obvious based on price action.
Each time there is a drop, the lowest point is a higher low.
Each time there is an advance, the market ends up producing a higher high...
I know, people are allergic to bottom prices so right now everybody is away but, there is good news; soon the market will be trading really high up and once prices are high, everybody is ready to trade.
Huge potential for growth on this chart. These target can be hit within 1-3 months, 3-6 months with the potential open for higher than what is shown.
Namaste.

ONDOUSDT Long SetupONDOUSDT is approaching 472 day support trendline. I am expecting a deviation from the trendline. In an ideal case looking to long from 0.62$ - 0.68$ range in portions. Lets see how it plays out.
Note: This is not a financial advise please DYOR

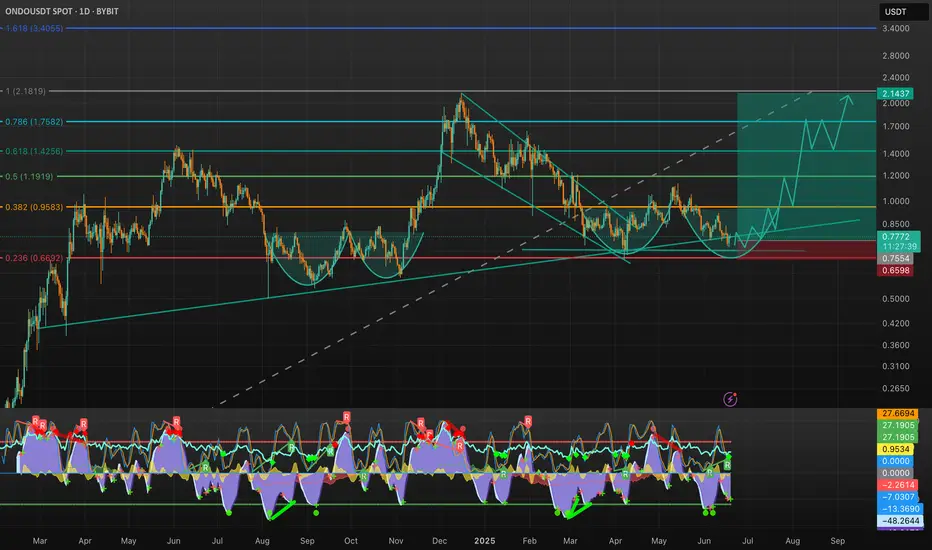
ONDO — Reversal or more Pain ahead? After a strong rally back in 2024, ONDO topped at $2.15 — completing a clear 5-wave impulsive move. Since then, price has entered a prolonged downtrend, dropping over -70%, with no confirmed reversal signs yet.
We’re now trading around a critical zone near $0.70. So the question is: where’s the next potential bottom?
🔎 Technical Breakdown:
📍 VWAP Breakdown:
The yellow anchored VWAP (Volume Weighted Average Price) has been lost — a clear sign of market weakness. This VWAP was previously acting as support but has now flipped to resistance, which often precedes continued downside.
📌 Key Support Zone:
$0.80–$0.70 was a structural support area that has now been broken — another bearish sign.
📉 Fibonacci Confluence:
Taking the structure and applying a Fibonacci retracement, the 0.786 retracement lies at $0.4828 — let’s round that to a critical $0.50 zone. This level is important for several reasons:
Liquidity rests at a previous key low at $0.50128
Anchored VWAP Band (0.618 multiplier) aligns with the same area
The 8/1 Gann Fan also intersects around this zone
All roads lead to the $0.50 level as a potential high-probability reversal zone. A bounce from here — especially with volume confirmation or reversal candlesticks etc. — would be a signal worth watching.
💡 Educational Insight: Importance of 0.786–0.886 Fibonacci Zone + VWAP
While many focus on the 0.618 retracement, bear markets often go deeper.
The 0.786–0.886 zone is where emotional exhaustion kicks in — traders give up, liquidity pools build, and smart money steps in.
Combining this with Anchored VWAP adds precision:
VWAP reflects where the “average buyer” is positioned. When price reaches confluence with both deep fibs and VWAP fib bands, you have a statistically powerful setup for reversals.
🚨 Note: These zones are not automatic buy levels — watch for confirmation signs before entering.
🛎️ Set your alerts, stay patient, and as always let the trade come to you.
_________________________________
💬 If you found this helpful, drop a like and comment!
Want breakdowns of other charts? Leave your requests below.

ONDO LONG FOR 2H 2025🔥 LSE:ONDO long setup (1D) 🚀
✅ Entry Zone: $0.62 – $0.685 (year-to-date demand)
🎯 Targets
• TP-1: $1.30 (post-IPO mid-range)
• TP-2: $1.70 (liquidity vacuum test)
⛔ Stop-Loss
Daily close < $0.54
📊 Thesis
• $95 M OUSG now settles via BlackRock’s BUIDL 🏦
• USDY hit $350 M TVL & 7 chains in 12 mo 📈
• Ondo Chain (omnichain RWA hub) launching 2025 🔄
• Coinbase roadmap + expanding Arbitrum, Solana support
• Tokenised Treasuries narrative heating up (Goldman, GSIBs) 🔥
Ondo (ONDO): Reached Another Pump Zone | Good Entry Right HereOndo coin reached the local liquidity trend, where reaching this area was signaling us of upcoming smaller buyside movement.
So that's what we are looking for right now as well, a healthy upward movement towards our major target area at least.
Swallow Academy

#ONDO bounce from POINT OF CONTROL, targeting RANGE HIGHONDO found support at it's POC on the daily. if BTC.D lets it, it will want to head towards it. range high. (also VAH)
This isn't ondo specific, rather a case of BTC loses 108500 or also finds support there and invalidates its lower high pattern, to head towards ath.

Ondo Scalp trade take with sl , this is a 5m scalp trade, So take it at your own risk with small amount

#ONDO/USDT#ONDO
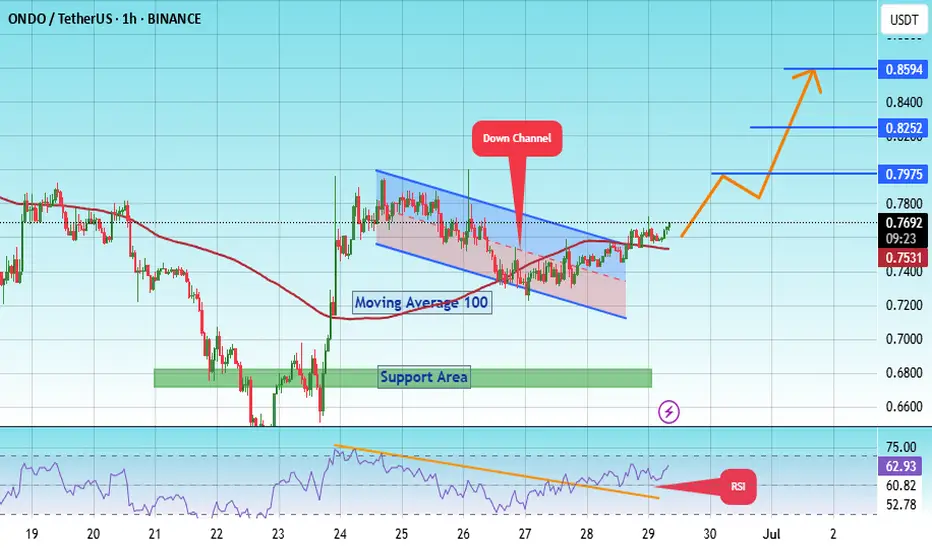
The price is moving within a descending channel on the 1-hour frame, adhering well to it, and is heading for a strong breakout and retest.
We have a bounce from the lower boundary of the descending channel. This support is at 0.7220.
We have a downtrend on the RSI indicator that is about to be broken and retested, supporting the upside.
There is a major support area in green at 0.6757, which represents a strong basis for the upside.
Don't forget a simple thing: ease and capital.
When you reach the first target, save some money and then change your stop-loss order to an entry order.
For inquiries, please leave a comment.
We have a trend to hold above the 100 Moving Average.
Entry price: 0.7975
First target: 0.7975
Second target: 0.8252
Third target: 0.8600
Don't forget a simple thing: ease and capital.
When you reach the first target, save some money and then change your stop-loss order to an entry order.
For inquiries, please leave a comment.
Thank you.
$ONDO Accumulation Zone Analysis #ONDO is currently trading witLSE:ONDO Accumulation Zone Analysis
#ONDO is currently trading within a strong weekly demand zone between $0.60 – $0.40, marked by heavy historical buying interest and multiple successful bounces. This area has acted as a reliable accumulation range in the past, forming a potential triple bottom or inverse head & shoulders pattern — both classic reversal signals.
🔸 Support at $0.40 – $0.60:
This zone has been tested multiple times, confirming buyers' interest. The red horizontal line around $0.40 is the ultimate invalidation point for bulls.
🔸 Upside Target:
The white projection line shows a potential rally after price confirms breakout above $0.91 resistance, targeting previous highs near $2 – $2.50, in line with historical resistance.
🔸 Risk Level at $0.38 (Invalidation):
If price closes weekly candles below $0.40, this bullish structure is invalidated. A strict stop loss should be placed just under this region.
🔸 Outlook:
Accumulate in the $0.60 – $0.40 range, ideally with staggered entries. Wait for confirmation breakout above $0.91 for aggressive exposure. Monitor for bullish volume and structure around the neckline.

ONDO | Potential Long Setup | Technical Structure + MarketCipherThe chart speaks clearly:
✅ Falling wedge breakout supported by higher lows
✅ A potential cup-and-handle continuation forming
✅ Bullish divergence on Market Cipher B, signaling momentum reversal
🔍 Trade Setup Details:
Entry Zone: 0.76 – 0.78
Stop Loss: Daily close below 0.66
Target Area: 2.14 – 2.18 (aligned with 0.618 Fib and measured wedge target)
Risk/Reward: 1:4+
Market Cipher B shows similar structure to previous cycle bottoms: green dot + momentum turning up
⚠️ Caution Note:
While the setup is technically clean, macro volatility (FOMC decisions, BTC dominance shifts) can heavily influence the outcome.
If the market environment aligns, this is a textbook bullish setup.
If not, discipline on stop-loss is essential.
🧠 Plan the trade. Trade the plan. Leave emotion out.
#ONDO #AltcoinSetup #CryptoAnalysis #MarketCipher #TechnicalAnalysis #SmartMoney #ONDOUSDT #CryptoTrading

ONDOUSDT Bullish Retest Entry – Momentum Continuation PlayONDOUSDT.P is showing a potential bullish continuation after a clean rebound from intraday support. The price successfully retested the breakout level around 0.8100, forming a possible higher low, indicating renewed buying interest. This setup aims to capture the next upward leg with a tight stop-loss, offering an efficient risk-to-reward opportunity.
Trade Setup:
Entry Price: 0.8097 USDT (just above support and breakout retest)
Take Profit (TP): 0.8644 USDT
Stop Loss (SL): 0.7919 USDT
Risk:Reward Ratio (RRR): 1 : 3.02
Potential Gain: +0.0547 USDT → +6.75%
Potential Loss: -0.0178 USDT → -2.20%

$ONDO/USDT Analysis📊 $ONDO/USDT Analysis 📊
📉 #ONDO swept the SSL and bounced strongly, reclaiming the PML 💪
🔹 Trendline support holding well — eyes on a retest for a potential long with confirmation🔍
Let price come to you. No rush, just precision🎯

ONDO Scalp ideascalp idea 16 june
- divergence stoch.
- demand area
- long consolidation
- possible bouncing in this area


ONDOUSDT trade PlanONDOUSDT is forming a larger A-B-C corrective structure on the daily timeframe. The current wave count suggests that wave C is underway with bullish targets at 2.2287, 3.1943, 4.7567, and 6.3191. Structure remains valid as long as the recent low holds as the end of wave B.
#ONDO #Crypto #ElliottWave #ABCStructure #WaveC #Altcoins #CryptoAnalysis #Bullish #TechnicalAnalysis #TradingView #CryptoTrader

ONDOUSDT 1D AnalysisONDO ~ 1D Analysis
#ONDO Buy back on a retest of this support block with a short term target of at least 15%+ from here. Long term target $2.1

ONDO Finance Potential Bullish Breakout OpportunityONDO Finance seems to exhibit signs of overall potential Bullish momentum if the price action forms a prominent Higher High with multiple confluences through key Fibonacci and Support levels which presents us with a potential long opportunity.
Trade Plan:
Entry : 1.3
Stop Loss : 0.47
TP 1 : 2.13

ONDO Bottom?Ondo possible bottoming.
Consolidate in daily timeframe.
The grab
breakout diagonal trendline.
could breakout in the consolidation area soon.

ONDO/USDT – Attempting breakoutONDO/USDT – Attempting breakout
ONDO is currently testing a key resistance level and attempting to break out of a consolidation zone. If the breakout is confirmed with strong volume and price holds above the breakout line, a bullish move of 15–30% could follow.
Key levels to watch:
* Breakout zone
* Support just below breakout
* Volume confirmation
Keep an eye on ONDO — if it holds above resistance, it may trigger a strong upside move in the short term.
