ONDOUSDT - LONG- Broke out of consolidation and 0.98 resistance with gd vol.
-Trendline support
-retested 50EMA and holding.
expected to break 21EMA and retest 1.31
ONDOUSDT trade ideas

TradeCityPro | Deep Search: In-Depth Of ONDO👋 Welcome to TradeCity Pro!
In this analysis, I want to fully review the ONDO project for you. First, I’ll go over the project’s information, and then we'll move on to its technical analysis.
🔹Introduction to Ondo Finance (ONDO)
Ondo Finance is an open and decentralized investment bank designed to bridge the gap between traditional finance and decentralized finance (DeFi). Founded in 2022 and based in the Cayman Islands, Ondo's mission is to democratize access to institutional-grade financial services. Its ecosystem is built to serve a wide range of stakeholders including DAOs, institutional players, and retail investors. Ondo's key innovation lies in tokenizing real-world assets, thereby making them accessible to a broader audience via blockchain technology.
🔹ONDO Token and Governance
The ONDO token plays a central role in the governance of the Ondo decentralized autonomous organization (DAO). Token holders have specific rights within the DAO, particularly over the governance of Flux Finance, which is one of the main platforms in the Ondo ecosystem. ONDO holders are empowered to propose and vote on changes, allocate funds for projects, and influence the platform’s direction, ensuring community-driven governance. The ONDO token sale occurred in mid-2022 and was purchased by over 18,000 individuals.
🔹Technology and Infrastructure
Ondo leverages blockchain technology to offer decentralized financial services. It operates on a secure and transparent distributed ledger system, which ensures that transactions are immutable and resistant to tampering. The platform uses Proof-of-Stake (PoS) as its consensus mechanism to validate transactions, offering both security and energy efficiency. Ondo is also integrated with various DeFi protocols and utilizes techniques from traditional finance to repackage DeFi exposures into institutional-grade risk-return profiles. Strategic partnerships with firms like BlackRock, Morgan Stanley, and Coinbase enhance its interoperability and credibility.
🔹Real-World Use Cases
Ondo's primary application is in the tokenization of real-world assets such as real estate or treasuries. This allows users to invest in fractionalized assets, lowering the barrier to entry for institutional-quality financial products. The platform is used for intellectual property management through blockchain-based records, enabling secure and transparent tracking. Ondo also engages in community events and educational initiatives to raise awareness about blockchain technology. Furthermore, it offers technical and business development services such as smart contract deployment and treasury management to startups and institutions.
🔹Key Developments and Milestones
In 2022, the Ondo DAO was officially launched, providing a decentralized governance framework. Following that, the foundation introduced Flux Finance, a major protocol under Ondo DAO governance. The Ondo Foundation has formed several partnerships to expand its ecosystem and drive innovation. One of the important initiatives includes Ondo USDY LLC, which issues the USDY stablecoin. Ondo has also focused on education, contract deployment, and treasury management, solidifying its operational backbone and long-term strategic vision.
🔹Team and Founders
Ondo Finance was founded by Nathan Allman and a team of former Goldman Sachs digital asset professionals. Nathan Allman brings a strong background in engineering and financial operations, serving as a key driver of the project’s vision. The founding team’s experience in traditional finance has been instrumental in shaping Ondo’s hybrid model, which integrates DeFi tools with institutional-grade strategies.
🔹Fundraising and Token Sale
Ondo Finance has conducted multiple fundraising rounds. An initial coin offering (ICO) took place on CoinList on May 12, 2022, raising $22 million. The token was priced at $0.055, with a minimum purchase of $100 and a maximum of $20,000. Another funding round was the IEO on Gate.io Startup, conducted from January 17 to January 18, 2024, which raised $40,000.
In total, Ondo has raised $46.04 million, including $22.04 million from public sales and $24 million from private and institutional funding rounds.
🔹Tokenomics
The ONDO token has a maximum supply of 10 billion tokens. Distribution is divided as follows: 52.1 percent for ecosystem growth, 33 percent for protocol development, 12.9 percent for private sales, and 2 percent for community access sales. As of now, 33.9 percent of the total supply is unlocked, with another 19.4 percent scheduled for future unlocks. Approximately 46.7 percent remains locked.
🔹Vesting Schedule
The vesting of ONDO tokens is structured into distinct categories. Ecosystem growth tokens are released linearly over five years, with 24 percent unlocked as of January 2024 and 39.2 percent expected to unlock gradually. Protocol development tokens have a one-year cliff, followed by a three-year linear unlock, with 25 percent becoming available in April 2025. Private sales follow the same schedule as protocol development, while community access sales were 90 percent unlocked from the beginning with full linear unlock over one year.
—
Certik: 87.50✅
🔹Top Ondo Wallets
Trust Wallet
imToken
MetaMask
Torus
Coinbase
TokenPocket
iToken Wallet
Binance web3 wallet
🔹Liquidity Pools
Uniswap
Balancer
🔹Top Holders
0x677fd4ed8ae623f2f625deb2d64f2070e46ca1a1
0x460ae5a6666fcb9635ba99b541b31279e59665370x
524083970c7a1e62fbaa61d38781f87a4f191fd0
0xa63eace47618b9677261b09b32e3ca2b5c0a0182
0xd2e6e930e25456ffcd4df0124563cc334f3284f4
🔹Significant TVL Growth in Ondo Despite Sharp Liquidity Decline
Since mid-January 2025, the total value locked (TVL) in Ondo has increased from 157,000 ETH to 631,000 ETH, reflecting significant growth in its TVL. However, in terms of liquidity, Ondo has experienced a sharp decline since late March, with a drop of nearly 50% compared to the previous month.
🔹On-Chain Analysis of ONDO
Looking at ONDO’s on-chain data, the $0.833 level stands out as a key support zone based on the concentration of tokens currently in profit. On the flip side, the $0.856 area acts as a resistance level, with approximately 124 million ONDO tokens currently held at a loss. However, the volume of tokens in profit remains higher overall, which can be interpreted positively — these zones represent value and may attract increased demand.
From a network activity perspective, there has been a noticeable decline, particularly in the number of new addresses being created.
Analyzing supply and demand, approximately 75% of ONDO tokens are held by whales, indicating strong whale dominance. Address-level data shows that wallets holding between 10 and 100 million tokens have shown minor demand, while older holders are contributing meaningful inflows. Additionally, wallets identified as "investor" addresses have also demonstrated renewed buying interest.
👀 Now that we’ve reviewed the project's details, let’s dive into ONDO’s technical analysis.
📅 Weekly Timeframe
In the weekly timeframe, as you can see, there aren't many candles yet, so we can’t perform a complete analysis on this timeframe.
✔️ However, you can observe that after the project launched in January 2024, there was an upward movement up to the 1.3927 area, followed by a correction down to 0.5871.
💥 After this correction, the next bullish leg continued up to the 2.0565 area.
📈 During this bullish cycle, there’s also an ascending trendline that the price has reacted to multiple times, and now it has touched it again.
⚡️ The main support on this timeframe is at 0.5871, and the main resistance is at 2.0565. So, if you already hold ONDO and are considering setting a stop-loss, breaking 0.5871 could be a good point to activate it.
🔽 This level can also be used as a trigger for a short position. Breaking 0.5871 could create a downtrend in ONDO.
🛒 For spot buying, the main trigger is breaking 2.0565, and if this level is broken, the price could register a new ATH.
📅 Daily Timeframe
In the daily timeframe, as you can see, the price has been supported by the trendline and has shown a very quick reaction, with bullish momentum pushing it above the 0.9253 resistance.
📊 Currently, the price has reached the SMA99 and reacted to it. The volume of the candles reacting to the SMA99 has increased, and if the price stabilizes above the SMA99, the main bullish leg could begin.
💫 The next resistance the price faces is at 1.1933, and if the SMA99 is broken, I believe the price can easily rise to this level.
☘️ Moreover, if this level is also broken, the price could climb up to 2.0565.
📉 For ONDO to turn bearish on this timeframe, the first trigger would be a fake breakout above 0.9253.The main bearish trigger would be breaking both the trendline and the 0.7122 level.
📝 Final Thoughts
This analysis reflects our opinions and is not financial advice.
Share your thoughts in the comments, and don’t forget to share this analysis with your friends! ❤️

Ondo my expected target.Ondo good project with a lot of growth potential, this is what I expected from this bull run.

ONDO Looking BullishWe have several bullish confluence indications for ONDO:
- Bullish RSI Divergence
- Higher High on the Daily
- Break of 0.92 resistance, now support
- Break of red descending trendline
Next major resistance levels are at 1.20 and 1.60.

ONDO HVF ONDO showing a nice squeezing pattern to the upside on an upside HVF as a strong Alco with a 3.5 risk reward ratio on this pattern and a target above $1 trigger entry on break of the third impulse high
ONDO 4H – Fake Breakdown Reversed, Bullish Momentum BuildsBYBIT:ONDOUSDT is exhibiting a strong bullish reversal pattern on the 4H chart, aligning with the broader ascending channel observed on the daily timeframe. After a brief deviation below the channel, which acted as a bear trap, the price swiftly re-entered the channel and broke above the descending resistance trendline. This move indicates a resurgence of buyer strength and a potential shift in market sentiment.
Following the breakout, COINBASE:ONDOUSD has been consolidating above the broken trendline and the ascending channel's support, suggesting that the previous dip was a false breakdown. This consolidation phase often precedes significant upward movements. If the bullish momentum continues, we can anticipate ONDOUSDT targeting the mid-channel resistance around 1.40, with the possibility of challenging the 2.00 zone or even reaching new all-time highs.
On the fundamental front, Ondo Finance has recently made headlines by engaging in discussions with the U.S. Securities and Exchange Commission (SEC) regarding the tokenization of U.S. securities. This strategic move aims to bridge traditional finance with blockchain technology, enhancing the project's credibility and long-term growth prospects.
🔔 Follow for real-time updates!

ONDO/USDTOndo created divergence on daily time frame and break the downtrend resistance with good volume, looks good at current price we can trade.
Trade Plane
Target 1: 1.21
Target2 : 1.65
Stop Loss: 0.66

ONDO DAILY TIMEFRAME UPDATE ❤️ THIS POST AND I WILL SHARE NEXT pair
#ONDO DAILY TIMEFRAME UPDATE
ONDO token holders are entrusted with shaping the future of the Ondo DAO so that it continues to pursue its mission to democratize access to institutional-grade finance
ANY THOUGHTS ON LSE:ONDO ?
Ondo Finance & The Altcoins 2025-Bull MarketBullish momentum across the Altcoins market is starting to build up at a rapid pace.
To me, it seems like everything is growing but looking at the chart, it is actually true that we are still trading at bottom prices.
The main prediction for this bullish wave, cycle and phase was set for May. "Strong bullish action will start to develop in May, while the entire market will be super bullish in late May 2025." This is now becoming true.
This is true and happening but there is still plenty of time to join the ride.
It is still early. Not early in the sense that we are at a true bottom, but it is still early when considering the bullish cycle total growth potential.
Here we have ONDOUSDT (Ondo Finance) and the current rise will lead to a new All-Time High. Truly, just coming out of a major low, a higher low.
The action is moving weekly above EMA8 and EMA13 for ONDOUSDT. A descending trendline is being broken this week. The bullish action is basically starting now.
Two weeks ago, we were predicting the bottom. Now the bottom is confirmed. After the bottom, the next logical step is up. Ondo, Bitcoin, Cardano, XRP, Dogecoin, Solana, Filecoin, Notcoin. Toncoin and the rest of the Altcoins market will grow. It is already growing but from a major low point. And this is good, low means low risk if you decide to buy today. Low means high potential for rewards if you wait patiently for the full bullish wave.
» Think long-term. Focus on the long-term.
Set a waiting time of 3-6 months. First high in 2-3 months, the next one in 6 months, more or less. This will bless you with massive gains.
I am here to share what I learn. The market is good now, it is an opportunity that doesn't come often and cannot be missed.
Buy and hold. This is an easy win.
Namaste.

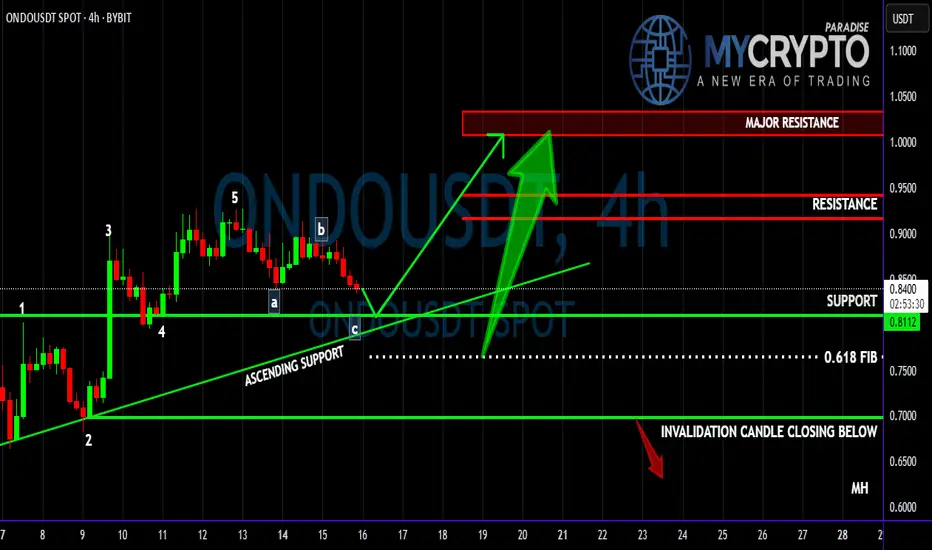
Is ONDO About to Crash Before the Next Big Rally? Yello Paradisers, are you ready for the next big #ONDOUSDT move, or will you be caught off guard by the next dump? Let’s break down what’s really happening here before it’s too late.
💎#ONDOUSDT has been following a clear Elliott Wave impulse structure. After completing the 5th wave of the impulse move, we’ve now entered the corrective phase. So far, the A and B waves have already played out, and now the C wave seems to be on its way — likely heading toward a key support area around 0.8112.
💎This support level is not just psychological — it also aligns perfectly with a well-respected ascending trendline, giving the level even more technical confluence. If buyers step in strongly here, this could be the launching point for the next impulsive bullish leg.
💎However, if the 0.8112 zone fails to hold, there’s a high probability we could see a deeper correction — potentially down toward the 0.618 Fibonacci level. This would still be a technically valid correction and might attract even stronger buying interest.
💎On the flip side, confirmation of bullish continuation would come once the pair regains momentum from the support zone and pushes towards the higher resistance levels. Watch closely for reactions in those zones — they will dictate the strength of the next leg up.
💎The invalidation of this bullish structure would be confirmed if we get a candle close below 0.6967. This would mean a break below both the ascending trendline and the 2nd wave of the Elliott impulse — a clear sign to reassess the structure.
Strive for consistency, not quick profits. Treat the market as a businessman, not as a gambler. Stay sharp and follow the structure — it's unfolding right in front of us, Paradisers.
MyCryptoParadise
iFeel the success🌴
ONDO/USDT Reversal Setup – Targeting Mid S/R Zone NextLSE:ONDO has broken above the key descending trendline, signaling a potential shift in momentum. The price is now heading toward the mid S/R zone, which will be a critical level to watch.
Currently, ONDO shows strong upside potential as it trades within a broader sideways range. If bulls maintain control, we could see a continuation toward the upper resistance zone.
Momentum is building — eyes on the next move.
DYOR, NFA

ONDO Let it decide Long or ShortHello all,
I think this coin finished the deep correction, and waiting the confirmation to take off.
Enjoy
MIZ

ONDO/USDT: FALLING WEDGE BREAKOUT!🚀 ONDO Breakout Alert – 80%+ Potential Incoming?! 👀🔥
Hey Traders! If you're all about high-conviction plays and real alpha, smash that 👍 and tap Follow for more setups that actually deliver! 💹💯
ONDO has officially broken out of a long-term falling wedge, a classic bullish reversal pattern. After months of compression and lower highs, price has finally pushed above the resistance line — signaling a potential trend reversal is in play. 📊
🔹 Entry: CMP (~$0.87)
🔹 Targets: $1.20 / $1.42 / $1.63
🔹 Stop-loss: $0.772
🔹 RR Ratio: Excellent risk-to-reward setup
🔹 Leverage: Use low to moderate (Max 5x)
🧠 Trade Idea:
With volume slowly picking up and structure breakout confirmed, this setup could offer big upside potential. Spot entries also look attractive for mid-term accumulation.
💬 Drop your thoughts or charts below — let’s ride this one smart and together! 🚀

$ONDO: Potential Reversal in SightLSE:ONDO : Potential Reversal in Sight
Signs suggest that LSE:ONDO may have reached the bottom of its consolidation phase, having fully retraced to its August 2024 lows. Momentum is shifting:
MACD is climbing toward the median — a breakout above could signal the start of an explosive uptrend.
RSI remains neutral, leaving room for a strong move in either direction.
Volume is near all-time lows, often a precursor to a breakout.
If the projected move plays out, the next resistance levels (based on Fibonacci ratios) are:
🔹 TP1: $0.94
🔹 TP2: $1.17
🔹 TP3: $1.35
📉 DYOR | Not financial advice.

ONDO/USDT – Potential Breakout from Bullish Triangle FormationONDO/USDT – Potential Breakout from Bullish Triangle Formation
Description:
ONDO is currently forming a bullish symmetrical triangle on the 4H chart, following a successful breakout from a falling wedge pattern. The price is consolidating and appears to be building momentum for a potential sharp move to the upside.
A breakout above the $0.90–$0.942 resistance zone, backed by strong volume, could trigger a rally towards $1.01, $1.08, and potentially $1.17 in the medium term. Watch for a significant volume spike and a strong bullish candle to confirm the breakout. Key support levels lie at $0.776 and $0.751.
Technical Indicators:
Bullish price structure
MACD showing potential bullish crossover
Volume currently decreasing, indicating market waiting for a decisive move
Breakout confirmation is crucial. Stay alert and manage risk accordingly.

Ondo big move comingTextbook weekly bullish divergence formed on ondo
Buying around 0.80 selling 1$ 2$ long term target 5$

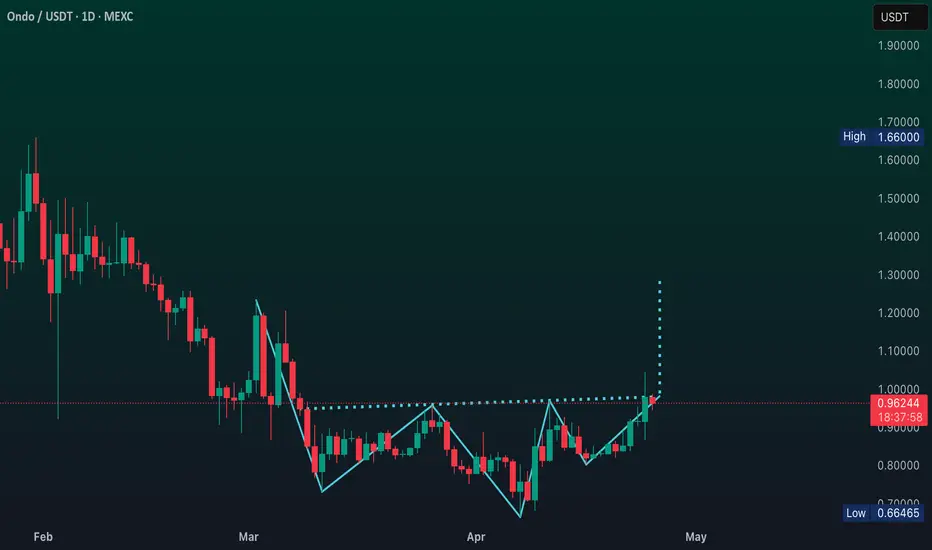
ONDO falling wedge breakout?LSE:ONDO 1D timeframe chart on the CRYPTOCAP:USDT market pair looks like a breakout from falling wedge. A falling wedge signals a bullish reversal pattern that often forms after a downtrend.
Targets for uptrend when momentum carries
Target 1: ~$1.2793
Target 2: ~$2.0059
Stoploss: ~$0.65

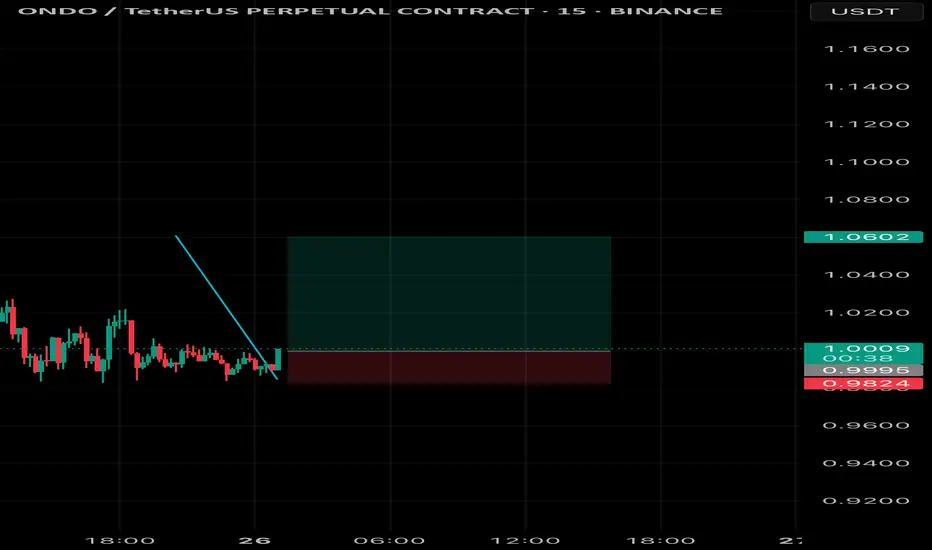
$ONDO ONDO LONGLSE:ONDO 4H - LONG
Updating the lower boundary of the local range forms conditions for opening long positions.
The scenario is relevant if the demand is confirmed in the marked zone.
Targets: $0.9277, $0.9894, $1.0799
TP/SL are presented on the chart.

ONDO/USDTThe coin has a globally bullish structure. I highlighted the area after the liquidity was removed where one can consider buying the coin.
Targets for growth:
Target 1 = 0.9277
Target 2 = 0.9570
Target 3 = 1.0508

1 ondo = 6 condomsThis was the pico bottom of ondo its never going under 30c again
Suggest you get a bag (if you like beautiful women and expensive things)

ONDOUSDT 1DONDO ~ 1D Analysis
#ONDO Buy gradually from here if you still have a Conviction on this coin with a short -term target of at least 10%+ from here.

Ondo Following The Macro TrendA New Era of Financial Inclusivity, Onchain🔗
#ONDO is rejecting the lower bound of its macro trend!
For the bulls to take over in the long term and kick off the next impulse move, a breakout above the $1 round number is needed.📈

ONDOUSDTConsidering the intersection of the volume range and VWAP and a valid bullish trendline and price support from this range, I consider this a good opportunity to enter this asset. I wanted to share with you friends.
