$ONE - left for dead but the risk:reward is there to be long$ONE was a darling in Q1 2022. Made a new low by end of Q1. Will they resurrect it? I think it's worth punting a long.
ONEUSD trade ideas

ONE CONTINUOUS OR REVERSAL?Elliot Wave count still valid, long 4th leg is normal.
Megaphone pattern formed, is it Continuous or a Reversal?
*TIPS IN THE CHART
RSI - HIGHER HIGH
MACD - FIRST BULLISH CROSS SINCE 2020
HODL ONTO YOUR BRITCHES...

MULTIPLE TIMEFRAME ANALYSISHaving Received countless of Approach on How I look at the Market to gain the Right Directional Bias, here I laid it out bear for your digestion.
I will like to say thank you for reading all my previous post and do not hesitate to comment or ask question.
TOP DOWN ANALYSIS APPROACH
This makes it easier to know which Direction you want to plan your trade in alignment to the HIGHER TIME FRAME.
I hope this will help your ongoing trader development and takes out those confusion when it comes to organising your bias,when to trade and when to be patient and when to start looking for opportunities on lower timeframe to then reduce your risk and keep you focus.
I will start from the Monthly Chart on ONEUSD a cryptocurrency called HARMONY that I believe will 10X it’s current price as we progress in Blockchain takeover
MONTHLY CHART
Monthly TimeFrame Blue 12EMA
A Support that act like a trendline
WEEKLY CHART
Same like Monthly 12EMA
But here Orange 36EMA on Weekly:A
Retracement level to consider adding new
Position in the Direction of the HTF
We saw a slowing week on the last red
That leads to the last week bounce
DAILY CHART
36EMA rejection Bounce on DAILY
Cautious area to take profit
Look for Rejection
Look to BUY Cheaper on OTF
8 HOURLY CHART
36EMA on 8HR with a Candlestick or
PRICE ACTION to look for the Discounted
LONGS and 2 good Confluences
Candlesticks HAMMER Price Action +
36EMA bounce
In Between the 200EMA
633EMA is a VOLATILITY GAP
This is where I observably expect
price to bounce Couple times in
betweenbefore we can make a directional
headway.
A VOLATILE REGION You can identify
in any market as price proceeds. So this gives you
a readiness awareness of what to expect and
for how long. 8HOURS represent a whole trading
SESSION
6HOUR CHART
Higher High 200EMA Selloff
on 6hr Corresponds the36EMA
on DAILY
BULLISH ENGULFING on 6hr 36EMA
after a potential longer term 8hr
(All Asian Session) Price Bounce
And maintaining of Higher Low
Price Structure
4HOUR CHART
Short Term Break of Structure (BOS) on 4hr
Chart is a good caution to let us know that
price won't just rise so easily higher
2 HOUR CHART
For Price to Change Direction
We have seen 1st 2hrs of hitting
200EMA rejection
Another 2hours of Price Slowing
without making a new low follow by 2hrs
of another Price Slowing after a Preceding
Downward Selloff Spiral
A clear indication of good 6hrs of consolidation
That eventually break out higher.Now we have
a good reason to look for BUY OPPS on
Smaller TF
The lower timeframe analysis will follow on hourly to minute charts.

Harmony can rise around 20%Harmony has found strong bids under 0.18 figure which is also a strong horizontal support.
Now the coin looks ready to recover some of the losses and the next target can be 0.22 zone resistance.
Also a buy trade for this coin can have a favorable R:R

Harmony (ONE) Update: Road back to ATH Harmony (ONE) Update 3/2/22: Since reaching its ATH price in October 2021 @ $0.39, Harmony has been consolidating in a range between the 38.20% & 78.60% fibs ($0.17 and $0.31). Harmony's current structure is forming a similar pattern to Bitcoin (BTC) and great relative strength in performance compared to other blockchain project during this downtrend. From the current price, Harmony is sitting in our Buy Zone to DCA and is a great opportunity to enter if you are not currently holding ONE. From the current price our $1 target is 448% gain away, when the current market sentiment returns and the bulls are back in control of Bitcoin we can expect the next impulsive way to push the price past the previous ATH and test the 261.80% fibs @ $0.96.
Our current Harmony (ONE) price targets from the current price:
127.20% fibs @ $0.49 (178% Gain)
161.80% fibs @ $0.61 (248% Gain)
261.80% fibs @ $0.97 (448% Gain)
423.60% fibs @ $1.54 (779% Gain)
Please see previous analysis below. Happy Trading :)
Update 19/12/21: Harmony (ONE) broke out of our Trendline since the December crash, we have now retested the 200sma and harmony looks ready for the next leg up. A moving average crossover will further confirm this move back up towards the 78.60% fibs and retest of the ATH @ $0.39. Our $1 target still stands and we can expect Harmony to reach this target over the next 2-3 months.
19/11/21: Harmony (ONE) is currently sitting in our Buy Zone. Lets see how this plays out, if we can hold this Buy zone as support this is very healthy for the next leg up for Harmony but if we break the current trend line we could retest the 200SMA between the 23.60% and 38.20% fibs ($0.12-$0.18).
01 /11/21 Harmony (ONE) Update: Road to $1 is still clear. There is a 300% Long Opportunity from the Buy Zone @ $0.22 to $1 (356% Gain). From the current price level Harmony (ONE) is 35% away from the new ATH price @$0.39. Harmony has been in a strong bullish continuation pattern since July and we can expect this trend to continue. The current retracement from the ATH (-35%) shows us signs of a weak retracement as we see signs of profit taking from the 26th October. From here Harmony (ONE) just needs a 2x from the current price to the $1 target. Although we have currently only experienced a weak retracement from the ATH we can expect Harmony (ONE) to retest the 50SMA just above the 50% fib retracement. This is where the optimal longs can be executed at the bottom of the trend line , in the range between the 50%-61.80% fibs.
Please see previous analysis below. Happy Trading :)
24/10/21: Harmony (ONE) is currently 8% from our price target at the 127.20% fibs @ $0.34 and just 34% away from the price target at the 161.80% fibs @ $0.42 🚀 For everyone thats been holding harmony since Q1 this has been worth it, steady approaching another new ATH and the $1 dollar target is still on the cards before eoy 🔥
Harmony (ONE) Update 10/10/21: Harmony (ONE) has grown over 50% from $0.16 to $0.24 over the past 2 days, retesting the ATH price at $0.23 and setting a new ATH at $0.26. From here we can expect Harmony to reach our next price target at the 161.80% Fibs @ $0.34 which is 38% away from the current price. See previous analysis below, Happy Trading :)
Update 08/10/21: Over the past 24 hours Harmony (ONE) has grown over 30% from $0.17 to $0.22, retesting the ATH price at $0.23, from here we can expect Harmony to reach our next price target at the 161.80% Fibs @ $0.34 which is 47% away from the current price. Please see previous analysis below. Happy Trading :)
Harmony (ONE) Update 16/09/21: Road back to ATH , Harmony looks ready for the next impulsive run up to retest the previous ATH @ $0.23. Next price target from current price at the 161.80% @ $0.36 (108% Gain) and 227% Fibs @ $0.53 (190% Gain). Please see previous analysis below. Happy Trading :)
Harmony (ONE) Update 10/09/21: Road back to ATH , 16% Gain to $0.23. Since the 1st September Harmony has grown 88% from $0.12 to $0.19, and is currently trading 16% away from the ATH price. After a retest of the ATH price we can expect Harmony to test the 127.20% (49% Gain from current price) and 161.80% Fibs (87% Gain from current price).
Harmony (ONE) Update 01 /09/21: Road back to ATH looks very clear from here. From here we can expect a 90% gain for Harmony back to ATH price @ $0.23 and from the current price at $0.12, it is a 137% Gain to a new ATH at the 127.20% fibonacci level which is our next key price target at $0.29. See previous analysis below. Happy Trading :)
Harmony (ONE) Update: The last time this happened, Harmony gained 5705% in 3 months (80 Days). The swing call script signalled a strong buy signal on 07/ 01 /21 @ $0.002, over the 3 months from Jan to end of March ONE gained 5705% hitting a new ATH @ $0.23. The swing call script was triggered on the 29th July and is a very strong indicator for a reversal from the previous downtrend, bottoming out @ $0.046 on 22nd June. Now is the time to Buy in confidence, we expect Harmony to recover 191% back to the ATH price level experienced during March over the next 2-3 months period.
This blockchain has given our portfolio 30x Gains since purchasing in early January. What a journey so far and we are gifted another opportunity (Swing Script gains are different)! Whats your eoy targets? Personally I think $1 and we might even reach higher price levels before EOY.
Will update EOY Targets and critical Buy Zones for entry.
See previous analysis below. Happy Trading :)

ONE trend change comingI am seeing evidence build up on this one...
1. ONE is now trading strongly above 10 10 EMA+MA and to boot MA (green) is on top of EMA (pink) EMA is more sensitive to price movement, so when the simple is on top it is a bullish signal. The signal is even stronger since we are looking at 4hr not 1hr candles.
2. MACD is above zero and above signal which is below zero and makes this call even stronger.
3. 12 hours of selling, (3x4hr) periods could not drag ONE down below any of the averages
4. Naturally the asset wants to seek support at the long term avg. line, which is the 200 DEMA in this case.
** $0.218 target price**
*this is not financial advice this trade is very risky. Please use caution when trading.
check links below for other trend change calls PI have made.

ONEUSDBlock-mine.io
Gold Nugget
Sustainable Liquidity Mining
(Gaming and Restricted Chain Routing)
CONTRACT: 0xe0b58022487131ec9913c1f3acfd8f74fc6a6c7e

ONE good to go?We can se higher prices in the future.Will try to accummulate some coins using Grid bot.

FUD has crept in... time to buy? I think so. I think we've gone down enough. I'm reading all the bearish posts and the fear, uncertainty, and doubt has forced it's way in. Harmony is still the most undervalued chain on the market and after some sideways movement, I would expect it to continue on its trend to the upside and hope to see a new ATH this year.
New entry @ .20

ONE revisits support ONE has found itself again at the lower level of the pitchfork. notice how many times support has been confirmed.
ONE has provided a great point to start entering.
Good Luck


HARMONY ONE- Time for Higher Harmony (ONE) Rallies At The Start Of 2022
Traders are interested in buying everything that can power the growth of the NFT market segment.
M www.fxempire.com odern cityscape and wireless sensor network, sensor node and connecting line, ICT (information communication technology), internet of things, abstract image visual, white space empty.
Harmony Enjoys Strong Support As Traders Look For Alternative Projects
ONE, a token of the Harmony blockchain network, gained strong upside momentum at the start of 2022. Harmony blockchain is designed to run “Ethereum applications with 2-second transaction finality and 1000 times lower fees”.
It looks that the market is finally searching for newer, more technologically advanced projects, so tokens of promising projects move higher while the world’s main cryptocurrency, Bitcoin, continues to slide.
Advertisement
Know where Bitcoin is headed? Take advantage now with
Start Trading
Trading Derivatives carries a high level of risk to your capital and you should only trade with money you can afford to lose. Trading Derivatives may not be suitable for all investors, so please ensure that you fully understand the risks involved, and seek independent advice if necessary. A Product Disclosure Statement (PDS) can be obtained either from this website or on request from our offices and should be considered before entering into a transaction with us. Raw Spread accounts offer spreads from 0.0 pips with a commission charge of USD $3.50 per 100k traded. Standard account offer spreads from 1 pips with no additional commission charges. Spreads on CFD indices start at 0.4 points. The information on this site is not directed at residents in any country or jurisdiction where such distribution or use would be contrary to local law or regulation.
In addition, low fees look good for the future of the NFT ecosystem. The interest in this market segment is growing fast, so traders rush to buy tokens which can benefit from the robust development of the NFT space.
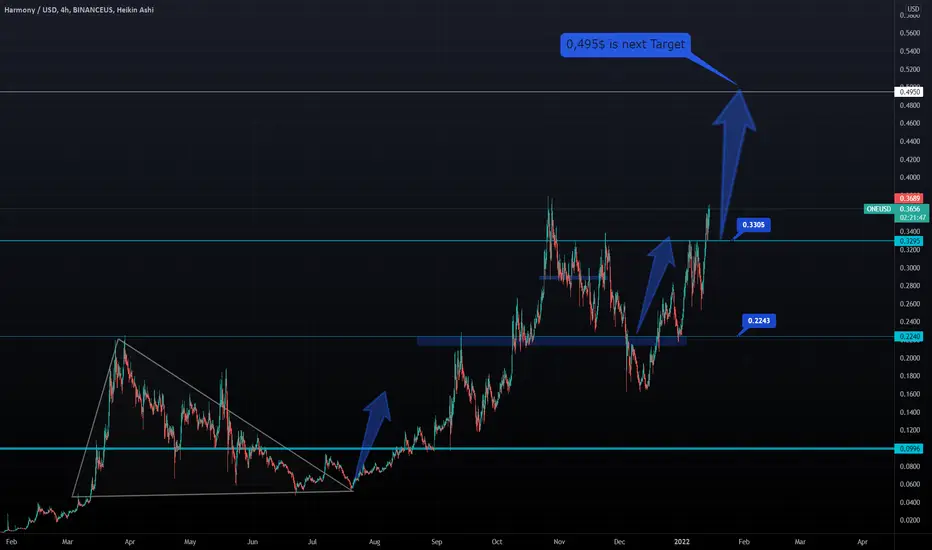
Time for higher, we see almost 0.50 as next resistance (target)
ONE Love,
the FXPROFESSOR
$ONE $HARMONY Re-Testing ATH?$ONE was one of the few ALT coins that significantly gained traction after $BTC and crypto made its potential bottom. I'm looking for a potential test of ATH and perhaps a nATH due to the increase in volume the past day. Note in mind that this will not go straight up, so be patient with the dips.

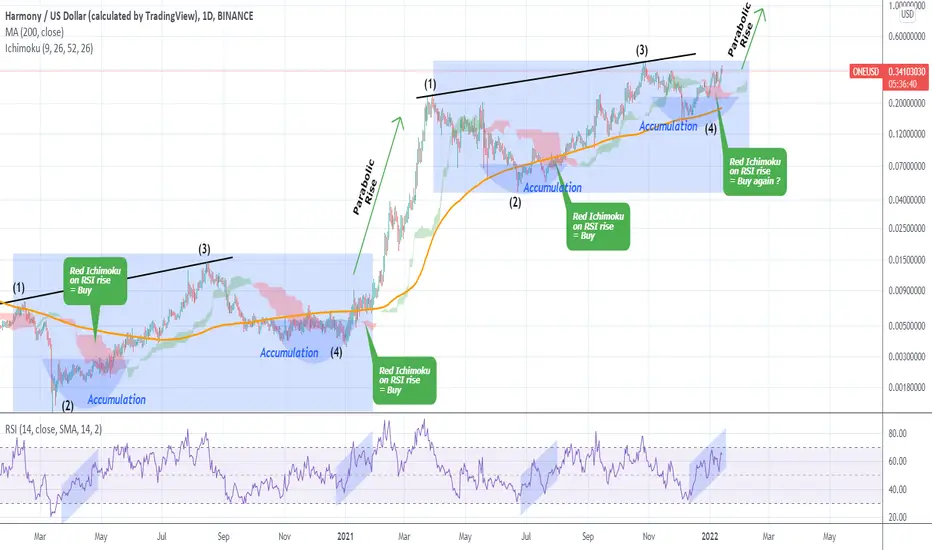
ONEUSD about to start a parabolic rallyHarmony is approaching the end of its second Accumulation Phase of this Cycle. The pattern is based on the previous Cycle that spanned for the whole year of 2020. Once the 2nd Accumulation phase of Cycle 1 ended, a Parabolic Rally started that took ONEUSD to Cycle 2.
As you see the two are similar with clear legs (1-2-3-4) indicating an identical price action. Notice that the best buy signals within those patterns are given when the Ichimoku turns red while the 1D RSI forms a Channel Up coming from the 30s level. We are on such a position right now. This indicates that ONE may be very close to start the new Parabolic Rally.
--------------------------------------------------------------------------------------------------------
** Please support this idea with your likes and comments, it is the best way to keep it relevant and support me. **
--------------------------------------------------------------------------------------------------------
Harmony (ONE) breakout confirmed... Harmony (ONE) breakout confirmed...
...new ATH near.
...price resistance now support
...MA Ribbon still supports
Next resistance to deal with on on RSI.
What do you think? 😎
Do you HODL this coin?
Drop me a nice comment if you'd like me to analyze any other cryptocurrency or do another comparison.
*not financial advice
do your own research before investing

Harmony $one C&H and IH&S looking for targets $.63 range potentially a 80+% move.
Non financial advice

cup n handle for $ONEcurrently hitting resistance at .34, i'm seeing a cup n handle pattern which could put this back to ATH around .40.

Harmony long Harmony bounced off the ascending trendline and bounced off the support level. Bullish movement to resistance level at 0.33 is expected to happen.

Harmony ONE continuation at 0.2750?The longest trend line in this chart has four touches, starting 14th December. Now that the price has fallen below the shorter, more recent trend, I’m wondering whether the stronger line below will hold - especially because there’s a reverse head and shoulders visible on the longer time scale.
If the longer line holds, I’m wondering whether the most recent three tops point toward a target price, because they did last time. That price appears to be around 0.2728 to 0.2754 this time.

ONE/USD - Harmony Price TargetsTake the price targets and actually sell some. don't be angry you didn't sell because "moon"

Harmony ONE Reverse H+S If there is one thing I learned this year it's that I should always pay attention to what's going up during market dips.
Harmony has been steady during this week when everything else has been dropping.
To make things more bullish, this looks like a pretty clear looking reverse H+S.
My only reservations is we're about to test ATH with heavy resistance at 0.3500/0.3600 area.
Ill be watching this closely. Would love to hear other peoples thoughts.

ichimoku trade : long positionbreaking the cloud,green cloud in future.
buy at 0.267$
stop loss: 0.226$ and if it rise it would be kijunsen.
