ONE/USDT Bullish with detailed plan1️⃣ Entry Zones (Buying Opportunities)
The entry zones are identified based on previous support levels, indicators, and potential reversal points.
✅ Key Buy Zones:
Primary Support Zone: $0.01700 - $0.00850
The chart highlights a green accumulation zone (equilibrium area), suggesting this range has been a strong historical support.
The stochastic indicator is near the oversold region, which aligns with potential bottom formations.
Past "Buy" signals (green markers) have been seen in similar zones.
Secondary Buy Confirmation: Around $0.02025 - $0.02150
If price breaks above this level, it could indicate early bullish momentum.
This region has acted as resistance previously and could turn into support if broken.
2️⃣ Sell Zones (Profit-Taking Levels)
The sell zones are based on historical resistance, Fibonacci retracements, and price action.
🚨 Key Resistance & Sell Zones:
$0.040 - $0.050 (Short-Term Profit Zone)
The previous price spikes have faced rejection around this level.
If price reaches this range, it's a good partial profit-taking zone.
$0.080 - $0.100 (Medium-Term Resistance)
The chart shows a dotted blue resistance line, indicating a historical supply area.
This is a key sell zone for swing traders looking to exit before heavy resistance.
$0.157 - $0.226 (Long-Term Target)
Marked as a "Target" in the chart.
If price breaks above $0.100, the next target zone aligns with previous cycle highs.
A full bullish breakout could push towards $0.226, the last significant high.
3️⃣ Trend Indicators & Momentum Analysis
Stochastic RSI: Near the bottom and crossing upwards, signaling a possible reversal.
Black Moving Average (MA) Line: Suggests price follows a cyclical wave, meaning another spike is possible.
Bottom Formations: The chart marks multiple "Bottom" points, indicating strong historical support.
4️⃣ Conclusion (Trade Strategy)
Ideal Entry: $0.017 - $0.0085 (Best accumulation zone)
Stop Loss: Below $0.0085 (Breakdown invalidates bullish setup)
Profit-Taking Zones:
🎯 Partial Take Profit: $0.040 - $0.050
🎯 Next Sell Target: $0.080 - $0.100
🎯 Long-Term Hold: $0.157 - $0.226 (If price trends bullish)
### **📌 ONE/USDT Trade Plan – Risk Management & Execution Strategy 🚀**
This trade plan will outline a **strategic entry, exit, stop-loss, and risk-reward ratio** to help you optimize your trades in **Harmony (ONE/USDT)**.
---
## **1️⃣ Trade Setup – Key Levels**
| **Zone** | **Price Range (USDT)** | **Action** |
|--------------|----------------------|------------|
| **Primary Buy Zone** | **$0.01700 - $0.00850** | Best accumulation area |
| **Breakout Buy Zone** | **$0.02025 - $0.02150** | Early bullish confirmation |
| **First Target (TP1)** | **$0.040 - $0.050** | Partial profit-taking |
| **Second Target (TP2)** | **$0.080 - $0.100** | Major resistance level |
| **Final Target (TP3)** | **$0.157 - $0.226** | Full bullish breakout target |
| **Stop-Loss (SL)** | **Below $0.00850** | Invalidation zone |
---
## **2️⃣ Position Sizing & Risk Management**
To protect your capital, we use the **1-3% risk rule per trade**. Here’s how you can structure your trade based on your total trading capital:
### **Example Trade Risk Calculation:**
- 💰 **Capital:** $10,000
- 🔥 **Risk per trade:** 2% ($200 loss max)
- 📉 **Stop Loss:** Below **$0.00850**
- ✅ **Risk-Reward Ratio:** **1:3 or 1:5**, depending on targets.
| **Entry Price** | **Stop-Loss (SL)** | **Risk Per Token** | **Position Size (Risk = $200)** |
|---------------|-----------------|----------------|-----------------------------|
| **$0.01700** | **$0.00850** | **$0.00850** | **23,529 ONE tokens** |
| **$0.02025** | **$0.00850** | **$0.01175** | **17,021 ONE tokens** |
🔹 **Adjust position size** based on entry price to match your risk tolerance.
---
## **3️⃣ Execution Plan – How to Trade It**
### **Scenario 1: Accumulate in Support Zone ($0.017 - $0.0085)**
- 📌 **Limit Orders:** Place staggered buy orders in this zone.
- 📌 **Dollar-Cost Averaging (DCA):** If price dips, buy more at lower levels.
- 📌 **Monitor Volume & Momentum Indicators:** If price remains stable, increase position size.
### **Scenario 2: Breakout Confirmation ($0.02025 - $0.02150)**
- ✅ **If price breaks $0.02150 with volume, enter more aggressively**.
- 🎯 **First target:** $0.040 - $0.050 → **Take 30-40% profit**
- 🎯 **Second target:** $0.080 - $0.100 → **Take 40-50% profit**
- 🎯 **Final target:** $0.157 - $0.226 → **Let the rest ride for maximum profit**
🔻 **If price closes below $0.00850, exit the trade and cut losses.**
---
## **4️⃣ Advanced Strategy: Trailing Stop & Scaling Out**
🔄 **To maximize gains while minimizing risk**, use a trailing stop strategy:
- **After hitting TP1 ($0.040-$0.050), move SL to break-even.**
- **After TP2 ($0.080-$0.100), move SL to $0.040.**
- **For TP3 ($0.157-$0.226), trail SL below major support levels.**
💡 This method locks in profits while allowing for higher upside potential.
---
## **5️⃣ Summary of Trade Plan**
✅ **Best Entry:** **$0.017 - $0.00850**
🔺 **Breakout Buy:** Above **$0.02150**
🎯 **Profit Targets:**
- **TP1:** $0.040 - $0.050 ✅ (Partial Sell)
- **TP2:** $0.080 - $0.100 ✅ (Major Resistance)
- **TP3:** $0.157 - $0.226 ✅ (Full Bullish Target)
❌ **Stop-Loss:** **Below $0.00850**
📊 **Risk-Reward Ratio:** 1:3 to 1:5
---
### 🚀 **Final Notes & Execution Tips:**
- **Patience is key.** If price drops, don't panic – follow the plan.
- **Adjust stop-loss & position size** to manage your risk.
- **Monitor volume & trend indicators** to confirm momentum.
Would you like me to refine this plan further with a **visual risk-reward chart**? 📈
ONEUSDT.P trade ideas

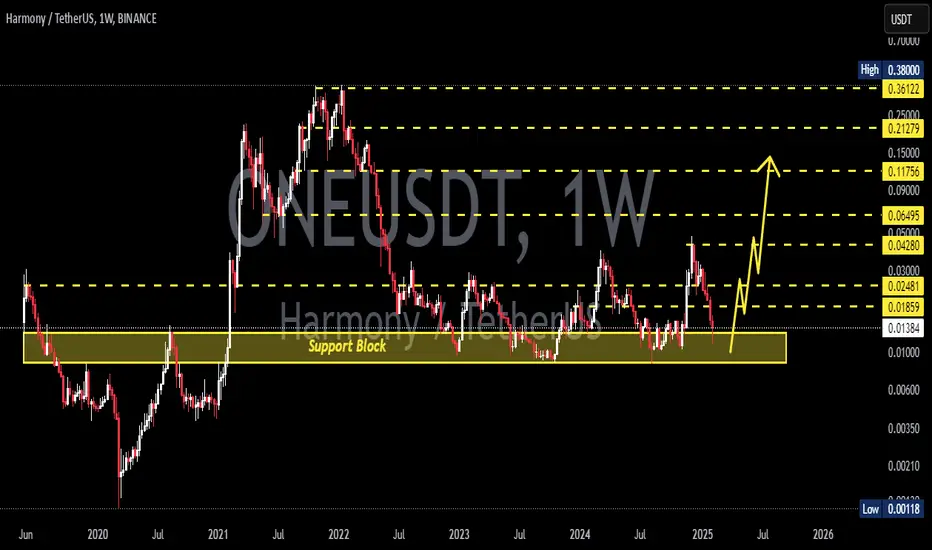
ONEUSDT 1WONE ~ 1W Analysis
#ONE This support block continues to be maintained so far. Buy from here with a minimum target of 20%+
HARMONY(ONE) POTENTIAL TARGETHarmony is a blockchain platform designed to facilitate the creation and use of decentralized applications (DApps). The network aims to innovate the way decentralized applications work by focusing on random state sharding, which allows creating blocks in seconds.

I will give you my thoughts you give me ideasI will give you my thoughts you give me ideas on what is happening here .

SPOT ONE LONG 23.01.2025Pinning after containment of sales.
🎯Purpose:
0.02915
I'll let you know when I record it manually.
‼️Risk per trade: 1% of the allocated funds for spot trading.

ONE 900% potential BINANCE:ONEUSDT
Possible Targets and explanation idea
➡️Would like to see drop to 0.5 of M FVG
➡️After retest of FVG we can see uptrend to First M Bullish FVG around 900%
➡️On Monthly timeframe ADZ indicator in biggest accumulation stage ever
Hope you enjoyed the content I created, You can support with your likes and comments this idea so more people can watch!
✅Disclaimer: Please be aware of the risks involved in trading. This idea was made for educational purposes only not for financial Investment Purposes.
---
• Look at my ideas about interesting altcoins in the related section down below ↓
• For more ideas please hit "Like" and "Follow"!

$ONE Break Out downtrend lineBINANCE:ONEUSDT
✅Before we start to discuss, I would be glad if you share your opinion on this post's comment section and hit the like button if you enjoyed it.
Thank you.
Possible Targets
➡️Marked 2 zones. Buyers zone green box, with strong support level since 2021
➡️Broke downtrend line since April (November was just double top and fake out)
➡️Next local possible target minimum 0.045 and if we will see good volume we can test even 0.08 price target
Hope you enjoyed the content I created, You can support with your likes and comments this idea so more people can watch!
✅Disclaimer: Please be aware of the risks involved in trading. This idea was made for educational purposes only not for financial Investment Purposes.
* Look at my ideas about interesting altcoins in the related section down below ↓
* For more ideas please hit "Like" and "Follow"!

#ONE/USDT Ready to go higher#ONE
The price is moving in a descending channel on the 1-hour frame and sticking to it well
We have a bounce from the lower limit of the descending channel, this support is at 0.02100
We have a downtrend on the RSI indicator that is about to break, which supports the rise
We have a trend to stabilize above the moving average 100
Entry price 0.02130
First target 0.02200
Second target 0.02250
Third target 0.02350

HARMONY/USDT AnalysisThe price is testing the red resistance zone.
🎯 Target if breakout occurs: Green line level

one coin bullish setupBINANCE:ONEUSDT as you can see after a huge pump one coin created a bull flag I think after a breakout we are going to see a massive rally so I will buy some coin in my spot wallet before a breakout. If you want you can buy some after breakout

ONEUSDT LONG breakoutLooks like a BOS pending on ONEUSDT with potential 80% gains back to 0.04.
Initial MSS was in march 2024 signalling a move up, then had a liquidity sweep of the lows in August with consolidation until Trump was elect.
The trendline break was during the US election, we have had a retest during December, now we need alt season to send us back to 0.04 and beyond.
A lot of liquidity was built up and around the level we are now, if price can break away it will retest this area before we go higher.
My targets are 0.04, 0.06, 0.08.
Long term targets are $1.
This is my view based on the charts also my interest in ONEUSDT, do your own research.
Any thoughts are welcome.

ONE ANALYSIS (3D)Before anything else, pay attention to the analysis timeframe. It is a 3-day timeframe and requires patience.
It appears that from the point marked with the green arrow on the chart, ONE has entered a Diametric pattern.
Currently, it seems to be in wave F of this Diametric. Wave F is bearish.
Within the green zone, buy positions can be considered.
A daily candle closing below the invalidation level will invalidate this analysis.
For risk management, please don't forget stop loss and capital management
Comment if you have any questions
Thank You

10x on Harmony!Harmony is keep making higher high's in 1W timeframe, so that means in longer run chart is still bullish and we have to look for entries. What BINANCE:ONEUSDT doing is hanging above minor support which is a good sign, but what I would like to see is breaking this support and close a candle below it. That is the perfect position to enter Long-position.
SPOT ONE LONG 9.01.2025Pinning after containment of sales.
🎯Purpose:
0.03062
I'll let you know when I record it manually.
‼️Risk per trade: 1% of the allocated funds for spot trading.
Thank you for follow and the reaction🚀.

#ONE (SPOT) IN ( 0.02200 - 0.03100)T.(0.15000) SL(0.02149)BINANCE:ONEUSDT
#ONE / USDT
Entry ( 0.02200 - 0.03100)
SL 1D close below 0.02149
T1 0.05600
T2 0.09800
T3 0.15000
3 Extra Targets(optional) in chart, if you like to continue in the trade with making stoploss very high.
______________________________________________________________
Golden Advices.
********************
* collect the coin slowly in the entry range.
* Please calculate your losses before the entry.
* Do not enter any trade you find it not suitable for you.
* No FOMO - No Rush , it is a long journey.
Useful Tags.
****************
My total posts
www.tradingview.com
1Million Journey
www.tradingview.com
www.tradingview.com
**********************************************************************************************
#Manta #OMNI #DYM #AI #IO #XAI #ACE #NFP #RAD #WLD #ORDI #BLUR #SUI #VOXEL #AEVO #VITE #APE #RDNT #FLUX #NMR #VANRY #TRB #HBAR #DGB #XEC #ERN #ALT #IO #ACA #HIVE #ASTR #ARDR #PIXEL #LTO #AERGO #SCRT #ATA #HOOK #FLOW #KSM #HFT #MINA #DATA #SC #JOE #RDNT #IQ #CFX #BICO #CTSI #KMD #FXS #DEGO #FORTH #AST #PORTAL #CYBER #RIF #ENJ #ZIL #APT #GALA #STEEM #ONE #LINK #NTRN #COTI #RENDER #ICX #IMX #ALICE #PYR #PORTAL #GRT #GMT #IDEX #NEAR #ICP #ETH #QTUM #VET #QNT #API3 #BURGER #MOVR #SKL #BAND #ETHFI #SAND #IOTX #T #GTC #PDA #GMX #REZ #DUSK #BNX #SPELL #POWR #JOE #TIA #TFUEL #HOT #AVAX #WAXP #OGN #AXS #GALA #ONE

ONEUSDT: Eyeing Weekly VWAP for Optimal Entry! ONEUSDT: Eyeing Weekly VWAP for Optimal Entry! 🌟📊
Key Points:
Price Check: ONEUSDT’s current price aligns well for a potential buy setup.
Weekly VWAP Opportunity: Aiming to catch an entry below the weekly VWAP for added confirmation and risk management. I would take half the risk I normally take.
Why This Setup?
Strategically buying below the weekly VWAP combines market sentiment and technical advantage. With indicators like CDV, liquidity heatmaps, volume profiles, and volume footprints, these demand zones offer high-value entry points.
Pro Tip: Confirm with low time frame market structure breaks and volume footprint support to maximize confidence in your trade.
If you find this analysis helpful, please boost, comment, and follow. Let’s make trading smarter, together!
Let me tell you, folks, this is amazing. Nobody does analysis like I do. Believe me. If this helps you, don't forget to boost and comment! It’s a big deal, motivates me to share even more winning insights with you. Tremendous insights.
I keep my charts the best, clean, simple, and clear. You know it, I know it, clarity leads to better decisions. No question about it. My approach? Built on years of tremendous experience. Incredible track record. I don’t claim to know it all, but I spot high-probability setups like nobody else. Trust me.
Want to learn how to use the heatmap, cumulative volume delta, and volume footprint techniques I use to determine demand regions with stunning accuracy? Send me a private message—totally free, folks. That’s right. I help anyone who wants it, absolutely no charge. Unbelievable value.
Here’s the list, long list, great list, of some of my previous incredible analyses. Each one, a winner:
🎯 ZENUSDT.P: Patience & Profitability | %230 Reaction from the Sniper Entry
🐶 DOGEUSDT.P: Next Move
🎨 RENDERUSDT.P: Opportunity of the Month
💎 ETHUSDT.P: Where to Retrace
🟢 BNBUSDT.P: Potential Surge
📊 BTC Dominance: Reaction Zone
🌊 WAVESUSDT.P: Demand Zone Potential
🟣 UNIUSDT.P: Long-Term Trade
🔵 XRPUSDT.P: Entry Zones
🔗 LINKUSDT.P: Follow The River
📈 BTCUSDT.P: Two Key Demand Zones
🟩 POLUSDT: Bullish Momentum
🌟 PENDLEUSDT.P: Where Opportunity Meets Precision
🔥 BTCUSDT.P: Liquidation of Highly Leveraged Longs
🌊 SOLUSDT.P: SOL's Dip - Your Opportunity
🐸 1000PEPEUSDT.P: Prime Bounce Zone Unlocked
🚀 ETHUSDT.P: Set to Explode - Don't Miss This Game Changer
🤖 IQUSDT: Smart Plan
⚡️ PONDUSDT: A Trade Not Taken Is Better Than a Losing One
💼 STMXUSDT: 2 Buying Areas
🐢 TURBOUSDT: Buy Zones and Buyer Presence
🌍 ICPUSDT.P: Massive Upside Potential | Check the Trade Update For Seeing Results
🟠 IDEXUSDT: Spot Buy Area | %26 Profit if You Trade with MSB
📌 USUALUSDT: Buyers Are Active + %70 Profit in Total
🌟 FORTHUSDT: Sniper Entry +%26 Reaction
🐳 QKCUSDT: Sniper Entry +%57 Reaction
📊 BTC.D: Retest of Key Area Highly Likely
And that’s just the start. The list goes on and on, folks. It’s a tremendous list, the best. I stopped adding because, frankly, it’s tiring. So many wins. People are amazed. You can check my profile and see for yourself, winning moves, all the time. Believe me, nobody does it better.

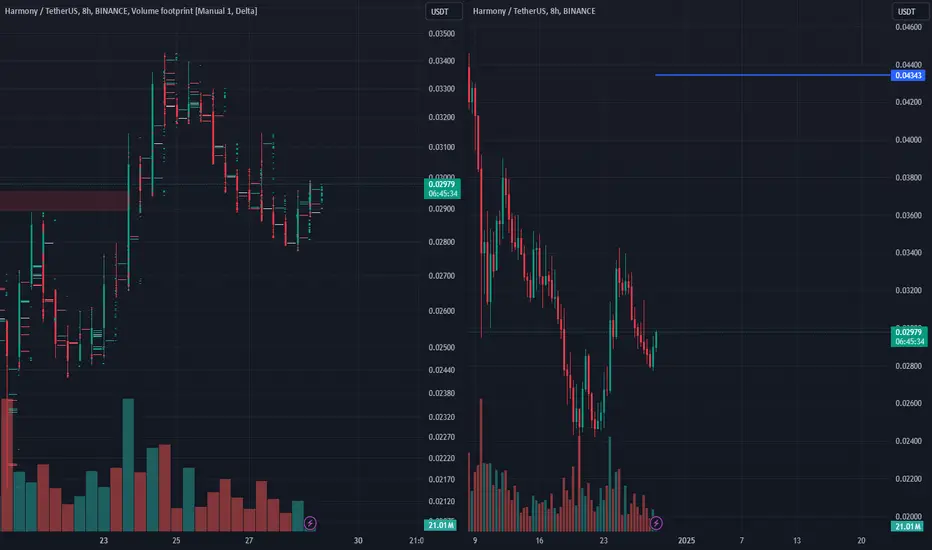
SPOT ONE LONG 28.12.2024Pinning after containment of sales.
🎯Purpose:
0.04343
‼️Risk per trade: 0.5-1% of the allocated funds for spot trading.
Thank you for follow and the reaction🚀.
Buy Signal for ONE/USDT📈 Buy Signal for ONE/USDT
✅ Suggestion: Open a market buy position now.
🎯 Target Levels: The labeled targets are expected to be reached soon.
🚨 Stop Loss: A specific stop-loss has been determined for this trade to manage risk.
💬 For managing this signal effectively and gaining access to more trading opportunities:
1️⃣ Follow my TradingView page 📊
2️⃣ Send me a private message for personalized guidance.
💎 Let’s profit together from this opportunity! 💰

Alikze »» ONE | Accumulation phase🔍 Technical analysis: The accumulation phase is ready for the bullish wave 3 rally - 1W
📣 BINANCE:ONEUSDT In the previous analysis, the weekly timeframe was corrected after hitting the supply zone, the details of which were examined.
🟢 On the weekly timeframe, it is in a three-year range in a concentration that is in the accumulation phase.
🟢 At present, given that the current supply zone has been consumed, we should wait for the zone break for the next supply zone.
🟢 Therefore, this upward leg will have the ability to grow to the neckline area, which can bring a 200-300% rally.
💎After breaking the second supply zone and consolidating above the area, it will have the ability to grow to the 84 cents area.
»»»«««»»»«««»»»«««
Please support this idea 💡 with a LIKE 👍 and COMMENT 💬 if you find it useful and Click "Follow" on our profile if you'd like these trade ideas delivered straight to your email 📧 in the future.
Thanks for your continued support.🙏
Best Regards,❤️
Alikze.
»»»«««»»»«««»»»«««

(update) ONEUSDT is ready to increase even further!After breaking the ascending Wedge , the price experienced significant growth. As you can see, the price has now dropped to under the the 0.618 Fibonacci line. Market volume indicates that the price may not be able to break above the 0.618 line, which means the price could drop alittle before rising again.
previous analysis
Give me some energy !!
✨We spend hours finding potential opportunities and writing useful ideas, we would be happy if you support us.
Best regards CobraVanguard.💚
_ _ _ _ __ _ _ _ _ _ _ _ _ _ _ _ _ _ _ _ _ _ _ _ _ _ _ _ _ _ _ _
✅Thank you, and for more ideas, hit ❤️Like❤️ and 🌟Follow🌟!
⚠️Things can change...
The markets are always changing and even with all these signals, the market changes tend to be strong and fast!!

ONE Analysis - What Shall we Expect !!!As you can see, ONE has created an ascending head and shoulders and is also located in the Falling wedge , which means that if it breaks, we expect the price to reach the target (AB=CD).
✨We spend hours finding potential opportunities and writing useful ideas, we would be happy if you support us.
Best regards CobraVanguard.💚
_ _ _ _ __ _ _ _ _ _ _ _ _ _ _ _ _ _ _ _ _ _ _ _ _ _ _ _ _ _ _ _
✅Thank you, and for more ideas, hit ❤️Like❤️ and 🌟Follow🌟!
⚠️Things can change...
The markets are always changing and even with all these signals, the market changes tend to be strong and fast!!

ONEUSDT Analysis: Strategic Demand ZonesONEUSDT presents high-potential demand zones , highlighted by the blue boxes . I’ve intentionally placed these zones lower , considering the market's potential to reach these levels around the Christmas period . This approach provides an opportunity for well-positioned entries if market conditions align.
Key Points:
Strategic Positioning: Blue boxes set intentionally lower for better entries in expected market dips.
Market Timing: Potential price action around Christmas aligns with these zones.
Confirmation Indicators: I will use CDV, liquidity heatmaps, volume profiles, volume footprints, and upward market structure breaks on lower time frames for validation.
Learn With Me: If you want to master how to use CDV, liquidity heatmaps, volume profiles, and volume footprints to identify precise demand zones, just DM me. I’d be happy to guide you!
Reminder: Be aware of the market's current state and approach it with caution. Successful trading relies on meaningful levels and robust confirmations.
If you think this analysis helps you, please don't forget to boost and comment on this. These motivate me to share more insights with you! Wishing everyone success in their trades.
If you think this analysis helps you, please don't forget to boost and comment on this. These motivate me to share more insights with you!
I keep my charts clean and simple because I believe clarity leads to better decisions.
My approach is built on years of experience and a solid track record. I don’t claim to know it all, but I’m confident in my ability to spot high-probability setups.
If you would like to learn how to use the heatmap, cumulative volume delta and volume footprint techniques that I use below to determine very accurate demand regions, you can send me a private message. I help anyone who wants it completely free of charge.
My Previous Analysis
🐶 DOGEUSDT.P: Next Move
🎨 RENDERUSDT.P: Opportunity of the Month
💎 ETHUSDT.P: Where to Retrace
🟢 BNBUSDT.P: Potential Surge
📊 BTC Dominance: Reaction Zone
🌊 WAVESUSDT.P: Demand Zone Potential
🟣 UNIUSDT.P: Long-Term Trade
🔵 XRPUSDT.P: Entry Zones
🔗 LINKUSDT.P: Follow The River
📈 BTCUSDT.P: Two Key Demand Zones
🟩 POLUSDT: Bullish Momentum
🌟 PENDLEUSDT.P: Where Opportunity Meets Precision
🔥 BTCUSDT.P: Liquidation of Highly Leveraged Longs
🌊 SOLUSDT.P: SOL's Dip - Your Opportunity
🐸 1000PEPEUSDT.P: Prime Bounce Zone Unlocked
🚀 ETHUSDT.P: Set to Explode - Don't Miss This Game Changer
🤖 IQUSDT: Smart Plan
⚡️ PONDUSDT: A Trade Not Taken Is Better Than a Losing One
💼 STMXUSDT: 2 Buying Areas
🐢 TURBOUSDT: Buy Zones and Buyer Presence
🌍 ICPUSDT.P: Massive Upside Potential | Check the Trade Update For Seeing Results
🟠 IDEXUSDT: Spot Buy Area | %26 Profit if You Trade with MSB
📌 USUALUSDT: Buyers Are Active + %70 Profit in Total
🌟 FORTHUSDT: Sniper Entry +%26 Reaction
🐳 QKCUSDT: Sniper Entry +%57 Reaction
I stopped adding to the list because it's kinda tiring to add 5-10 charts in every move but you can check my profile and see that it goes on..

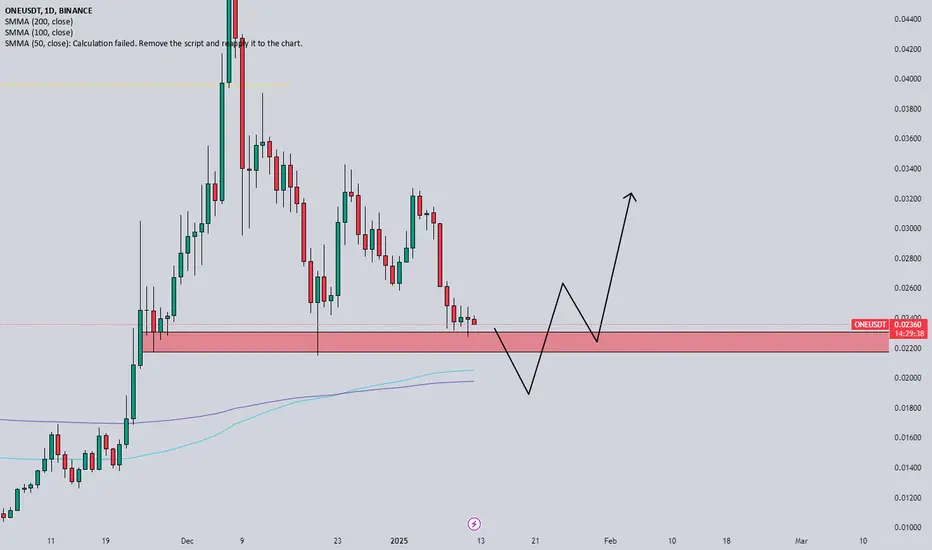
ONEUSDT AnalysisPossible rejection at 0.03 to 0.032.
Hard to say whether it will continue up or not past 0.033, but overall chart is bullish on the weekly timeframe.
Most likely just a matter of time before it breaks the 8th of December highs.
