ONE → OneCoin Weak at Resistance! Do we Fall or Break Through?OneCoin is struggling to continue upward at the Resistance Zone, hinting that the price wants to fall back to the EMA ribbons. Is this an opportunity to short? Or should we look for a long?
How do we trade this? 🤔
The last three candles have been relatively weak bull bars, especially the last one which ended as a doji (a one-bar trading range). The current Daily candle just started a couple of hours ago but has not yet shown any signs of strength. With the crypto market being bullish, we should be looking for a long entry.
We need to find the next strong support level to get a positive Risk/Reward Ratio, which appears to be around the 30EMA or 200EMA. A good strong bull signal bar followed by a confirmation bar closing on or near its high gives us enough probability of profit to take a long. Once these bars close, a long entry in the $0.01430 area with a protective stop below the 30EMA or trend support is reasonable. Set a take profit at 1:2 Risk/Reward around the $0.01550 area. It's also reasonable to take half profits at 1:1 and swing the rest until you see a sell signal, but be aware, we don't have much room up until the Resistance Zone.
Until then, let's see how the price action plays out. FOMO (Fear of Missing Out) is your worst enemy. This is where you enter the market prematurely, worried that you'll miss potential profits but instead, you end up in a bad trade. I find combating FOMO is best conceptualized as "You're making more money by not falling for the seduction of market profit."
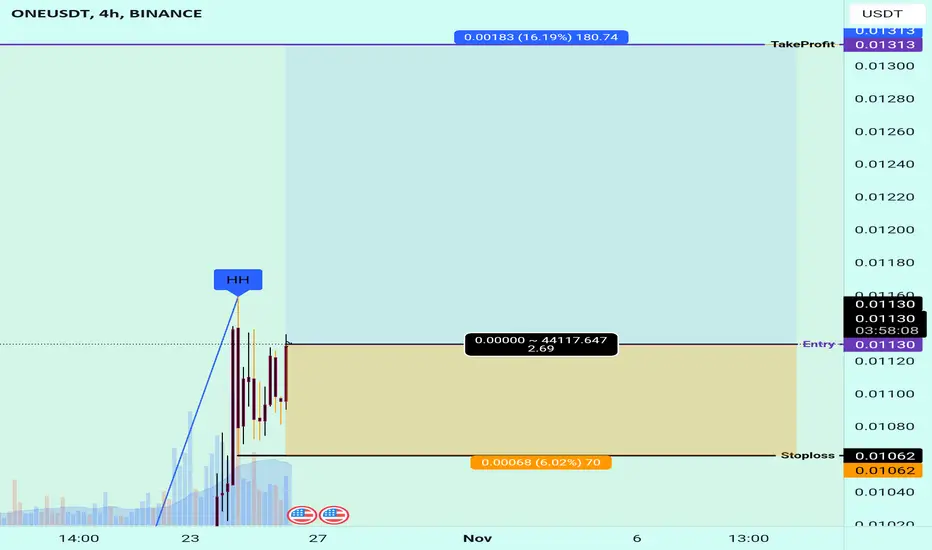
💡 Trade Idea 💡
Long Entry: $0.01430
🟥 Stop Loss: $0.01370
✅ Take Profit: $0.01550
⚖️ Risk/Reward Ratio: 1:2
🔑 Key Takeaways 🔑
1. Bull Macro Trend since October. Bias to Long!
2. Pin-Top Candles near Resistance Zone.
3. Still Above EMA Ribbons, Watch for Support.
4. Look for Long Entry at Daily 30EMA.
5. RSI at 64.00, above Moving Average. Wait for RSI to come down.
⚠️ Risk Warning! ⚠️
Past performance is not necessarily indicative of future results. You are solely responsible for your trades. Trade at your own risk!
Like 👍 and comment if you found this analysis useful!
ONEUSDT trade ideas

ONE/USDT Pumping is Coming ?? Harmony Analysis TodayHello Paradisers, Token to Watch Closely!
💎 ONE experienced a significant rejection at a crucial support level, forming a strong bullish hammer candle.
💎Today, ONE surged with a robust green candle to challenge the supply zone, only to be pushed back. It's likely that ONE will revisit the hourly demand zone before resuming its upward trajectory. Should it break through the supply zone, expect a sharp upward spike for ONE.
💎The bullish outlook would be invalidated if ONE closes below the designated green line area for the day.


ONE/USDT Just Broke Out of Descending Channel |👀🚀 What's Next?💎 Paradisers, turn your attention to ONEUSDT as it offers a significant trading potential. The asset has recently broken out of a descending channel, suggesting a strong possibility of an upward shift from a key support level.
💎 Over the recent weeks, Harmony has skillfully adhered to its channel pattern. Having reached the crucial internal support level at 0.00871, there's a high probability of a bullish reversal, which could lead to a breakout from the channel.
💎 The VRVP analysis supports this outlook, indicating that visits to key support levels often precede strong bullish movements. If this bullish trend gains traction, ONE is expected to aim for resistance levels at $0.0165 and $0.025.
💎 However, it's critical to monitor ONE's performance closely. A dip below the current support level of $0.0119 would signal a need to re-evaluate our trading approach. Such a decline could challenge the sustainability of the bullish trend, necessitating a strategic adjustment in response to the evolving market conditions.
💎 Stay vigilant and prepared, Paradisers. ParadiseTeam is here to equip you with insightful analysis and strategic advice to help you navigate these market scenarios confidently.

ONE "Riding the Litecoin Wave: A Strong Buy Signal Emerges!"Welcome to our crypto exploration hub! We're here to navigate the exciting world of digital assets, providing you with comprehensive insights into market dynamics and potential trading opportunities.Our mission is to decode the crypto market's mysteries and equip you with the knowledge you need to make informed investment choices. From the latest developments in Bitcoin to the hidden potential of various altcoins, we're your trusted source for daily technical analysis.While technical analysis is a valuable tool, it's important to remember that it's just one piece of the puzzle. We encourage you to take a well-rounded approach to your investments, considering factors like macroeconomic trends, news, and community sentiment.Join us for the freshest analyses, and don't hesitate to join the conversation in the comments below. Keep in mind that our content is purely for educational purposes and should not be construed as financial advice. Always integrate it into your broader investment strategy."

Things are coming down to the end of a massive downtrendseems like only a couple more weeks before we see either pain or tendies.

ONE → About to Drop!? Let's Prove it and Maximize Your Profits!OneCoin (Harmony) is failing to break the bear channel resistance and after a recent sell signal, is showing the symptoms of a drop to the previous low or even lower lows. If Bitcoin fails to break its Weekly Resistance, it could add some additional pain to the entire crypto market.
How do we trade this?
It's reasonable to short right now . We have the sell signal at the top of the bear channel and we're two legs down, maybe trying for a third lower low. Be prepared for support at the previous low of around $0.012. If a bull signal bar closing on or near its high with a follow-through bar appears, time to get out. Also, keep an eye on Bitcoin as a market indicator. If it decides to go bull, consider altering your bias to the upside.
Trade Idea
Short Entry : $0.0132
Stop Loss: $0.0145
Take Profit: $0.0113
Risk/Reward Ratio: 1:2
Key Takeaways
1. Bear Channel, Bias to Short.
2. Top of Bear Channel, Bias to Short.
3. Still Above 200EMA, Watch for Support.
4. Recent Sell Bar, Reversal Indicator.
5. RSI at 47.00, below Moving Average. Supports Short Bias.
You are solely responsible for your trades, trade at your own risk!
If you found this analysis helpful, click the Boost button and let us know what you think in the comment section below!

ONE to $0.01 or $0.02!? This Analysis Shows What to Look ForOne (Harmony) is making an attempt to finally break the bear channel resistance and rocket to $0.017, the previous high before the channel began. The market sentiment may have other plans, as Bitcoin and Ethereum struggle to get past their Weekly resistances.
How do we trade this?
The trend is your friend until the very end and right now, our bias should be toward the downside. A single data point is not enough to make a trade, we must also consider that at this moment we're at the bear trend resistance without a sell signal bar. Until we have a bear signal bar close on or near its low, best to wait on the sidelines. It also appears we had a bear capitulation candle/run just before this bull move, which often signals the *end* of a trend. Something to watch out for when making your next trade decision.
You can also wait for a bull signal to long, either at the 200EMA or Previous Low price area. Wait for a bull signal and confirmation bar closing on or near its high.
Key Points
1. Bear Channel, Bias to Short.
2. Capitulation Bear Candle, Could be the End of the Downside Movement.
3. Look for a double bottom to Long at 200EMA or the Previous Low.
4. Wait for Bear Signal Bar to Short.
5. RSI at 57.00, above Moving Average.
You are solely responsible for your trades, trade at your own risk!
If you found this analysis helpful, click the Boost button and let us know what you think in the comment section below!

Harmony , buying zone (investment only ) i see the red zone a perfect zone to start DCA (dollar cost averaging)
for investment only , not for trading
the zone has a high confluence with fib level , ichimoku strong support , and the highest volume is traded in this zone .
not a financial advice .
thank you

ONEUSDT"As we enter the bullish season, the initial target to aim for is
target : 0.2 🎯.
This is based on a combination of technical analysis indicators and market trends.
However, it's important to approach trading with caution and adapt to changing market
conditions.
Keep an eye on key support and resistance levels, as well as any significant news or events that may impact the market.
Remember to use proper risk management techniques and consider setting profit targets along the way.
Happy trading!"

#ONEUSDT #LQR #TOBTC #LaqiraProtocolThe price has faced selling pressure after a strong breakout of 0.012 and reaching the previous high of 0.017 Range. In the current range within certain ranges. you can look for reasons to enter after confirmation according to your personal strategy. This analysis is a personal view and the offer is not a buy or sell

Trade signal | Harmony (ONE) coin is ready for upto 19.50% pumpHi dear friends, hope you are well and welcome to the new trade setup of Harmony (ONE) coin with US Dollar pair.
Previously we caught more than 80% pump of ONE as below:
Now on a 4-hr time frame, ONE has completed a bullish BAT setup for the next price reversal.
Note: Above idea is for educational purpose only. It is advised to diversify and strictly follow the stop loss, and don't get stuck with trade.

ONE/USDT Bullish Horizon? 👀 🚀 ONE Today analysis💎Paradisers, ONEUSDT is currently engaging with a critical supply zone, suggesting a strong chance of breaking through and initiating a bullish trend.
💎 After a prolonged adherence to a descending trendline, ONEUSDT has made a commendable break to the upside. Presently, it's challenging a supply zone, with a substantial likelihood of breaching it.
💎 A successful breakout could pave the way to first target the .01923 supply level, followed by a push against the bearish Order Block.
💎 Conversely, should ONEUSDT struggle to surpass the .01479 supply, we might see a bullish resurgence from the .01216 demand level. A fall beneath this threshold could trigger a considerable bearish downturn.

ONE/USDT bullish ride? 👀 🚀 ONE today analysis💎Paradisers, turn your attention to ONEUSDT. It's currently showcasing compelling movements, firmly anchored at a crucial support level and gearing up for a potential bullish ascent.
💎 Historically, ONEUSDT has navigated within a channel for an extended period. Recently, it touched the channel's support and embarked on an upward path.
💎 The initial resistance it's likely to encounter stands at the .00952 mark, with a more formidable barrier at .01020. Given its position within the demand zone, we're hopeful that it might challenge these resistance levels soon.
💎 However, always be prepared: should the price descend below the current support, we might witness a pronounced bearish turn.
💎 Remember to employ prudent trading strategies and use proper stop-loss measures! Stay alert to market movements and look forward to more insight

ONE/USDT Significant Upward Movement, Bullish Momentum for ONE ?💎 ONE has undeniably piqued market interest. At present, ONE has broken through the Descending Channel, marked by a surge in volume and a notable upward trajectory. Interestingly, ONE didn't undergo a retest at the resistance trendline post the breakout but surged ahead, surpassing the supply zones of $0.01063 and $0.01139.
💎 It's plausible that ONE might enter a retesting phase at the previously established supply zone of $0.01139, which now acts as a demand area, before resuming its upward journey. Probability ONE will reach our target supply area.
💎 Should ONE fail to find support at the $0.01139 demand zone, there's a risk of it dropping further to the next demand level at $0.01063. This zone stands as ONE's final bastion for maintaining its bullish stance. If this area is also breached, it could signal a bearish trend for ONE, potentially driving it back to its primary support zone.

ONE COIN - BULL RUNThe Crypto Bull run is now going to begin, and as per technical analysis, the ONE COIN will become a rocket soon.
There are some target on cards that will hit soon.
Buy Call: $0.01340
Target 1: 0.02380
Target 2: $ 0.03137
Stop Loss: $0.000770

🔥 ONE Bear Market Low Is In? Huge Risk-Reward Trade!ONE has been performing exceptionally well over the last few weeks, boosted by regained confidece in Bitcoin.
In this analysis we're going to make the assumption that ONE's bear-market low is in and that the purple area will continue to hold in the future.
With a target at 30 cents and a stop below the bear-market low, we can construct a trade with a massive potential pay out of 8,000% your investment.

Harmony Secret Retest + Falling Wedge🚀Harmony (ONE) has been quietly making strategic moves in the crypto arena, and one of its recent maneuvers has unveiled an essential yet often unnoticed aspect of chart analysis: the retest of a crucial trendline. Furthermore, the formation of a substantial falling wedge on its weekly chart is sending bullish signals, indicating potential for exciting price action in the near future. 📉🚀
Rediscovering the Trendline Retest
Trendline retests are like hidden gems on a crypto chart. Harmony (ONE) showed its mettle by retracing back to a significant trendline, often going unnoticed by the crowd. This retest is a crucial aspect of price action analysis, as it confirms the trend's strength or highlights potential reversals.
The Falling Wedge: A Bullish Playground
But that's not all; Harmony (ONE) has another ace up its sleeve. The formation of a substantial falling wedge on the weekly chart is a hallmark of a bullish trend reversal. Falling wedges are characterized by a series of lower highs and lower lows that eventually converge. Once the price breaks out from the upper trendline, it typically embarks on an upward journey.
Trading Strategy: Navigating the Harmonious Journey
For traders and investors, recognizing these patterns is paramount. Harmony (ONE) provides an opportunity to enter or add to positions when the price eventually breaks out from the wedge. However, always integrate this insight into your comprehensive trading strategy, which includes risk management and exit plans.
Conclusion: Harmony's Melodious Move
Harmony (ONE) is orchestrating a melodious move in the crypto space, blending a stealthy trendline retest with the formation of a powerful falling wedge. This harmonic combination provides a potential setup for bullish price action in the coming weeks.
🚀 Crypto Insights | 💡 Trading Strategies | 💰 Market Analysis
❗See related ideas below❗
Share your thoughts and insights on Harmony's subtle yet promising chart formations.💚🌐💚

ONE Is the Only one That you can Trade Now. Welcome to our crypto exploration hub! We're here to navigate the exciting world of digital assets, providing you with comprehensive insights into market dynamics and potential trading opportunities.Our mission is to decode the crypto market's mysteries and equip you with the knowledge you need to make informed investment choices. From the latest developments in Bitcoin to the hidden potential of various altcoins, we're your trusted source for daily technical analysis.While technical analysis is a valuable tool, it's important to remember that it's just one piece of the puzzle. We encourage you to take a well-rounded approach to your investments, considering factors like macroeconomic trends, news, and community sentiment.Join us for the freshest analyses, and don't hesitate to join the conversation in the comments below. Keep in mind that our content is purely for educational purposes and should not be construed as financial advice. Always integrate it into your broader investment strategy."
One(Harmony) in trouble and prone to climb...Harmony is in a suitable ascending position. All the conditions indicate the rise. If the whole market moves up, a good upward movement is expected.
Anyway, this is a good place to buy and hold this token...

ONE will wake upThere has been no news from ONE for some time. But we have signs on the chart that show that ONE can have upward movements soon. By maintaining the demand area, it can go up to the supply area. Do not enter a position without capital management, leverage and stop setting.
I also specified the invalidation level, closing a daily candle above this level will cause an analytical violation.

ONEUSDT Elliott Waves Analysis (LONGTERM)Hello friends.
Please support my work by clicking the LIKE button👍(If you liked). Also i will appreciate for ur activity. Thank you!
Everything on the chart.
Entry zone: 0.01 - 0.007
Targets: 0.015 - 0.02 - 0.03
after first target reached move ur stop to breakeven
Stop: (depending of ur risk). ALWAYS follow ur RM .
risk is justified
Good luck everyone!
Follow me on TRADINGView, if you don't want to miss my next analysis or signals.
It's not financial advice.
Dont Forget, always make your own research before to trade my ideas!
Open to any questions and suggestions
