(update) ONEUSDT is ready to increase even further!After breaking the ascending Wedge , the price experienced significant growth. As you can see, the price has now dropped to under the the 0.618 Fibonacci line. Market volume indicates that the price may not be able to break above the 0.618 line, which means the price could drop alittle before rising again.
previous analysis
Give me some energy !!
✨We spend hours finding potential opportunities and writing useful ideas, we would be happy if you support us.
Best regards CobraVanguard.💚
_ _ _ _ __ _ _ _ _ _ _ _ _ _ _ _ _ _ _ _ _ _ _ _ _ _ _ _ _ _ _ _
✅Thank you, and for more ideas, hit ❤️Like❤️ and 🌟Follow🌟!
⚠️Things can change...
The markets are always changing and even with all these signals, the market changes tend to be strong and fast!!
ONEUSDT trade ideas

ONE Analysis - What Shall we Expect !!!As you can see, ONE has created an ascending head and shoulders and is also located in the Falling wedge , which means that if it breaks, we expect the price to reach the target (AB=CD).
✨We spend hours finding potential opportunities and writing useful ideas, we would be happy if you support us.
Best regards CobraVanguard.💚
_ _ _ _ __ _ _ _ _ _ _ _ _ _ _ _ _ _ _ _ _ _ _ _ _ _ _ _ _ _ _ _
✅Thank you, and for more ideas, hit ❤️Like❤️ and 🌟Follow🌟!
⚠️Things can change...
The markets are always changing and even with all these signals, the market changes tend to be strong and fast!!

ONEUSDT Analysis: Strategic Demand ZonesONEUSDT presents high-potential demand zones , highlighted by the blue boxes . I’ve intentionally placed these zones lower , considering the market's potential to reach these levels around the Christmas period . This approach provides an opportunity for well-positioned entries if market conditions align.
Key Points:
Strategic Positioning: Blue boxes set intentionally lower for better entries in expected market dips.
Market Timing: Potential price action around Christmas aligns with these zones.
Confirmation Indicators: I will use CDV, liquidity heatmaps, volume profiles, volume footprints, and upward market structure breaks on lower time frames for validation.
Learn With Me: If you want to master how to use CDV, liquidity heatmaps, volume profiles, and volume footprints to identify precise demand zones, just DM me. I’d be happy to guide you!
Reminder: Be aware of the market's current state and approach it with caution. Successful trading relies on meaningful levels and robust confirmations.
If you think this analysis helps you, please don't forget to boost and comment on this. These motivate me to share more insights with you! Wishing everyone success in their trades.
If you think this analysis helps you, please don't forget to boost and comment on this. These motivate me to share more insights with you!
I keep my charts clean and simple because I believe clarity leads to better decisions.
My approach is built on years of experience and a solid track record. I don’t claim to know it all, but I’m confident in my ability to spot high-probability setups.
If you would like to learn how to use the heatmap, cumulative volume delta and volume footprint techniques that I use below to determine very accurate demand regions, you can send me a private message. I help anyone who wants it completely free of charge.
My Previous Analysis
🐶 DOGEUSDT.P: Next Move
🎨 RENDERUSDT.P: Opportunity of the Month
💎 ETHUSDT.P: Where to Retrace
🟢 BNBUSDT.P: Potential Surge
📊 BTC Dominance: Reaction Zone
🌊 WAVESUSDT.P: Demand Zone Potential
🟣 UNIUSDT.P: Long-Term Trade
🔵 XRPUSDT.P: Entry Zones
🔗 LINKUSDT.P: Follow The River
📈 BTCUSDT.P: Two Key Demand Zones
🟩 POLUSDT: Bullish Momentum
🌟 PENDLEUSDT.P: Where Opportunity Meets Precision
🔥 BTCUSDT.P: Liquidation of Highly Leveraged Longs
🌊 SOLUSDT.P: SOL's Dip - Your Opportunity
🐸 1000PEPEUSDT.P: Prime Bounce Zone Unlocked
🚀 ETHUSDT.P: Set to Explode - Don't Miss This Game Changer
🤖 IQUSDT: Smart Plan
⚡️ PONDUSDT: A Trade Not Taken Is Better Than a Losing One
💼 STMXUSDT: 2 Buying Areas
🐢 TURBOUSDT: Buy Zones and Buyer Presence
🌍 ICPUSDT.P: Massive Upside Potential | Check the Trade Update For Seeing Results
🟠 IDEXUSDT: Spot Buy Area | %26 Profit if You Trade with MSB
📌 USUALUSDT: Buyers Are Active + %70 Profit in Total
🌟 FORTHUSDT: Sniper Entry +%26 Reaction
🐳 QKCUSDT: Sniper Entry +%57 Reaction
I stopped adding to the list because it's kinda tiring to add 5-10 charts in every move but you can check my profile and see that it goes on..

ONEUSDT AnalysisPossible rejection at 0.03 to 0.032.
Hard to say whether it will continue up or not past 0.033, but overall chart is bullish on the weekly timeframe.
Most likely just a matter of time before it breaks the 8th of December highs.

ONEUSDT AnalysisPossible rejection at 0.03 to 0.032.
Hard to say whether it will continue up or not past 0.033, but overall chart is bullish on the weekly timeframe.
Most likely just a matter of time before it breaks the 8th of December highs.

HARMONY flipsHarmony is showing signals of fliping movements.
MACD is trying to re eject the coin. and Rsi is in the 50 Line.
Today we have a masive 7% up
Today is pizza day.

#ONE/USDT#ONE
The price is moving in a descending channel on the 4-hour frame and is expected to continue upwards
We have a trend to stabilize above the moving average 100 again
We have a descending trend on the RSI indicator that supports the rise by breaking it upwards
We have a support area at the lower limit of the channel at a price of 0.02226
Entry price 0.02512
First target 0.02973
Second target 0.03367
Third target 0.3865

Harmony one to 0.14?Well, i see 5 waves up. Top of wave 1 lines up with fib level. Lets put some bids there and see how this one will roll.

Harmony $ONE💰 #Harmony LSE:ONE
#ONE released a breakout of Triple Bottom formation😳
896 Days we were accumulating inside the one🔥
Pump to the Major Supply Zone is guarantied Imo🚀
🎯1 Target - 0.07415$
🎯2 Target - 0.11975$
🎯3 Target - 0.20165$
🎯4 Target - 0.31915$

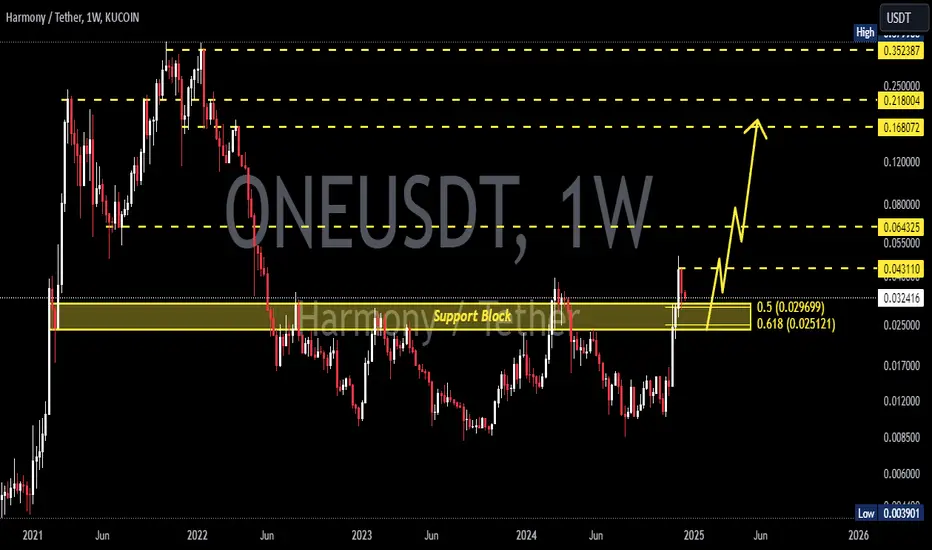
ONEUSDT 1WONE Update ~ 1W
#ONE If you still have Conviction on this coin,. This support block is a very good place to start buying gradually, with a target of at least 20%++
ONEUSDT Delivers a Whopping 1,500% Gain and Still Running!ONEUSDT on the 1-Day timeframe has delivered an explosive long trade setup, exceeding all profit targets. The trade has achieved an extraordinary 1,500% profit so far and continues to show strength for further upside momentum.
Key Levels:
TP1: 0.01510 ✅
TP2: 0.01804 ✅
TP3: 0.02099 ✅
TP4: 0.02280 ✅
Technical Analysis:
The trade was perfectly caught using the Risological Swing Trading Indicator , which provided a clear entry at 0.01328 and an SL at 0.01181 for disciplined risk management.
Price action shows a strong uptrend, with consistent support from the Risological Trend Line, pushing ONEUSDT beyond all set targets. Profit-taking at higher levels remains ideal while monitoring for further gains.

Harmony is READY!As you can see BINANCE:ONEUSDT able to close a candle above 0.04 area which means breaking a neck of H&S pattern. You can think of it as beginning, and we may never see this price again. So this will be the opportunity invest in Harmony ( BINANCE:ONEUSDT ). I will be taking profits at those marked green lines.

ONEUSDT.1DThe daily chart of ONE/USDT highlights a significant bullish momentum as the price approaches a key resistance level. This analysis will assess the current market structure, identify major support and resistance levels, and evaluate the implications of technical indicators.
Price Action and Structure:
ONE/USDT has seen a strong upward movement, breaking past earlier resistance levels and is currently trading near $0.04363. The price is approaching the key resistance at $0.03171 (R1), marked by previous peaks and a psychological barrier.
Resistance and Support Levels:
Resistance Levels: Immediate resistance is identified at $0.03171 (R1). Breaking above this level could open the way to higher prices, potentially testing the resistance at $0.04600 (R2), which would align with the upper trend projections.
Support Levels: Key support is currently situated at $0.02191 (S1), which may serve as the first line of defense in case of a pullback. Further support can be found at $0.00839 (S2), which is critical for maintaining the longer-term bullish outlook.
Moving Averages:
The price has sustained above the moving averages, indicating a strong bullish trend. The moving averages might serve as dynamic support in case of minor price retractions.
Technical Indicators:
MACD: The Moving Average Convergence Divergence (MACD) is in the positive territory, with the MACD line above the signal line, suggesting continued bullish momentum. However, the histogram shows a slight reduction in momentum, indicating a possible consolidation or slowdown.
RSI: The Relative Strength Index (RSI) is near 78, indicating that the asset is approaching overbought conditions. This level suggests caution, as it may lead to a potential pullback or price consolidation in the near term.
Conclusion:
ONE/USDT exhibits strong bullish behavior, approaching significant resistance at $0.03171 (R1). A breakthrough this level could pave the way for further gains towards $0.04600 (R2). However, given the near overbought conditions on the RSI, traders should remain cautious of potential reversals or consolidations. The support levels at $0.02191 (S1) and $0.00839 (S2) are crucial and should be monitored for potential buy-backs if a downward correction occurs. Investors and traders should consider these technical indicators and resistance levels to strategize their entries and exits effectively.

ONEUSDT: Analysis of Key Buying AreasThe blue and green boxes on this chart represent critical buying zones, identified using a blend of advanced technical analysis techniques. These zones indicate areas where strong buying pressure is expected, making them ideal for potential long positions. Below is a detailed breakdown of their significance and trading approach:
1. The Concept of Buying Zones
Buying zones are price regions where a reversal or bounce to the upside is likely. These zones are derived from significant support levels and historical price reactions.
Blue Boxes: These are primary buying zones , indicating areas with the highest confidence of support. They are often identified from higher timeframes, such as daily or 4-hour charts, and reflect strong confluence levels like Fibonacci retracements or key order blocks.
Green Boxes: These are secondary buying zones , providing additional opportunities but with slightly lower confidence. These zones typically stem from intraday price action and minor structural support levels.
2. How Are These Zones Determined?
The buying zones are meticulously drawn using the following methods:
Fibonacci Levels: Focused on 0.618–0.786 retracement areas for strong support.
Order Blocks: Highlighting the last bullish or bearish candle before an impulsive price move.
Volume Profile: Identifying high-volume nodes, which often act as significant price magnets.
Market Structure: Analyzing higher highs and higher lows to define areas of structural support.
3. How to Trade the Zones
When the price enters these buying zones, here’s how to approach it:
Blue Box – High-Confidence Trade:
Monitor for confirmation signals such as bullish candlestick patterns (e.g., engulfing or pin bars).
Place stop-loss orders just below the zone’s boundary to minimize risk.
Green Box – Lower Priority Trade:
Use tighter stop-losses and wait for stronger intraday confirmations, like breakouts from local resistance.
Be mindful of higher risks as these zones are not as robust as blue boxes.
4. Additional Confirmation Signals
Strengthen your entries by combining these signals:
Bullish Divergences: Look for RSI or MACD divergences aligning with the zones.
Volume Spikes: A sharp increase in volume near the zones indicates institutional interest.
Reclaim of Key Levels: A break above nearby resistance after bouncing from the zone confirms upward momentum.
5. Example Scenarios
Scenario 1: Price enters the blue box and forms a bullish engulfing candle. Enter a long position, set a stop-loss below the zone, and target the next resistance level.
Scenario 2: Price dips into the green box but holds above the lower boundary. Wait for consolidation and a breakout before entering.
I keep my charts clean and simple because I believe clarity leads to better decisions.
My approach is built on years of experience and a solid track record. I don’t claim to know it all, but I’m confident in my ability to spot high-probability setups.
My Previous Analysis
🐶 DOGEUSDT.P: Next Move
🎨 RENDERUSDT.P: Opportunity of the Month
💎 ETHUSDT.P: Where to Retrace
🟢 BNBUSDT.P: Potential Surge
📊 BTC Dominance: Reaction Zone
🌊 WAVESUSDT.P: Demand Zone Potential
🟣 UNIUSDT.P: Long-Term Trade
🔵 XRPUSDT.P: Entry Zones
🔗 LINKUSDT.P: Follow The River
📈 BTCUSDT.P: Two Key Demand Zones
🟩 POLUSDT: Bullish Momentum
🌟 PENDLEUSDT: Where Opportunity Meets Precision
🔥 BTCUSDT.P: Liquidation of Highly Leveraged Longs
🌊 SOLUSDT.P: SOL's Dip - Your Opportunity
🐸 1000PEPEUSDT.P: Prime Bounce Zone Unlocked
🚀 ETHUSDT.P: Set to Explode - Don't Miss This Game Changer
🤖 IQUSDT: Smart Plan
⚡️ PONDUSDT: A Trade Not Taken Is Better Than a Losing One
💼 STMXUSDT: 2 Buying Areas

Harmony (ONE)📊 Comprehensive Analysis of Harmony (ONE)
🔍 Overview: Harmony, after experiencing significant trading volume, successfully broke out of its descending channel. The breakout of the weekly resistance zone (yellow area) in the weekly timeframe opens new opportunities for upward movement.
🕰 Technical Analysis:
Current Situation: The price, having surpassed the weekly resistance, is poised to target Fibonacci levels of 1.618 and 2.618.
RSI Analysis:
RSI is encountering a critical resistance level that could temporarily halt the upward momentum.
A breakout above this resistance could push RSI into the Over-Extended zone, which may trigger a sharp price surge.
🎯 Recommendations and Entry Points:
Layered Entry Strategy:
First Entry: At the current price zone.
Second Entry: After a correction and pullback to the yellow zone (previously broken resistance).
📌 Key Considerations:
Risk Management: Proper capital management and risk allocation are crucial.
Market Volatility: Sudden market reactions can lead to unexpected losses. Failing to adhere to effective risk management could result in significant setbacks.

ONE Coin Market Structure Analysis on Daily TimeframeWeek swing is bullish.
Day swing is bullish => currently is pullback.
The current price is in the daily demand zone, so we can look for buying opportunities in this zone

Harmony (ONE) Opens 4,000% Growth Potential —2025 & 2024This is a classic case of resistance turned support. Also a classic case of 4,000% growth potential...
Good morning my fellow Cryptocurrency trader, the market is treating you good today.
This is huge and it is amazing and it is incredible to say the least. ONEUSDT (Harmony) is showing more than 4,000% potential for growth and it has been growing already for months.
The same level that worked as resistance is 2020 worked as support in 2024.
The most revealing signal, the strongest one, is a break above EMA55 and EMA89 on the weekly timeframe. The week closing today (24-November) means that we are set for maximum long-term growth. This is great. It is awesome.
Seeing the market go ultra-bullish-green confirms everything we've been saying for months. The time to buy is late 2024 in anticipation of the 2025 bull-market, which has been confirmed long ago. It is happening now.
This is the initial bullish breakout. The start of the first wave of the bull-market. Then we will have a second one that ends in a new All-Time High with a major bull-run. This is later in 2025, let's not get ahead of ourselves. Buy and hold.
Sell when prices are high and enjoy the profits on the way up.
If you make a mistake, don't worry about it because opportunities are endless in the Cryptocurrency markets.
Namaste.


1hr cup & handle continuation after 121% move Harmony ONEOne appears to be consolidating on the 1hr as a cup & handle continuation pattern after a 121% move.
Could break down 10% from the bullish ascending triangle and consolidate into the handle.
Harmony One can potentially see much higher prices if we progress further into alt coin season.
If the short-term charts breakdown, as long we hold $0.02 - $0.024 as support, ONE would be in larger bull flag continuation pattern.

ONE Impulsive Wave
The strong upside movement is part of an impulsive wave which began in early August.
In my primary count, we should soon reach the end of blue wave 3.
Corrections to the green support zone (around 0.022-0.023) will be interesting to look for new long trade opportunities.

$oneusdt clear 2x opportunitiyhello trader. we are on the bull market, and most of coins will do their run. But which one.
Here is the one of them, $oneusdt. Chart is really good and it is ready to start rally.
Entry and exit prices are on the chart for long and short idea.
** Please LIKE 👍, FOLLOW ✅, SHARE 🙌 and COMMENT ✍ if you enjoy this idea! Also share your ideas and charts in the comments section below! This is best way to keep it relevant, support us, keep the content here free and allow the idea to reach as many people as possible. **

HOTUSDTHMT v1.0 spotted. Looking good with previous wave up with increasing volume and momentum.
- BOS (Breaks of Structure) at @ 0.002199 - 0.002315 level
- Trending slow and steady if able to hold above the BOS level
It is at extremely good reward to risk level.

Harmony ONE Tripple Bottom 100% - 1000+% Harmony ONE is attempting to break out of a Tripple Bottom trend change pattern. If it can hold above the point of control, we could see 270% upside.
There could be a pull back on the daily, as long as we consolidate above $0.02, quadruple bottom, could 10x in alt season.
