ONEUSDT trade ideas
#ONE(SPOT) entry range(0.01030- 0.01230) T.(0.02599) SL( 0.0101)BINANCE:ONEUSDT
entry range (0.01030- 0.01230)
Target1 (0.02199) - Target2 ( 0.02599)
SL .1D close below (0.0101).
*** Collect the coin slowly in the entry range ***
*** No FOMO - No RUSH - it is a long journey ***
**** #Manta #OMNI #DYM #AI #IO #XAI #ACE #NFP #RAD #WLD #ORDI #BLUR #SUI #VOXEL #AEVO #VITE #APE #RDNT #FLUX #NMR #VANRY #TRB #HBAR #DGB #XEC #ERN #ALT #IO #ACA #HIVE #ASTR #ARDR #PIXEL #LTO #AERGO #SCRT #ATA #HOOK #FLOW #KSM #HFT #MINA #DATA #SC #JOE #RDNT #IQ #CFX #BICO #CTSI #KMD #FXS #DEGO #FORTH # AST #PORTAL #CYBER #CLV #RIF #ENJ #ZIL #APT #MAV #ZRX #RENDER #THETA #CHZ #MASK #ONE ****

ONEUSDT Bullish Breakout After 150 DaysONEUSDT Technical analysis update
BINANCE:ONEUSDT has formed a parallel channel at the bottom, and the price broke the channel resistance line with high volume on the daily chart. The price is trading above both the 100 and 200 EMAs, confirming a trend change. This breakout occurred after 150 days of a ranging market
BINANCE:ONEUSD

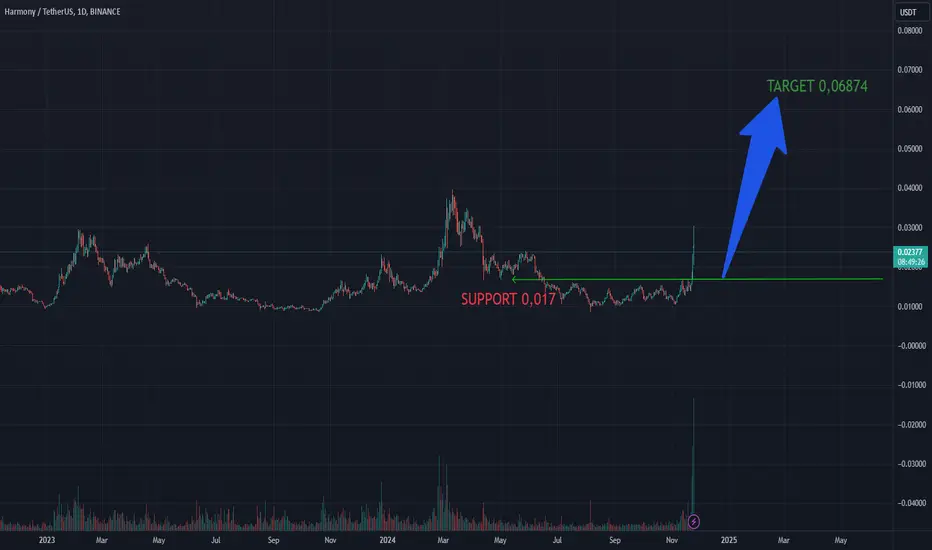
ONE/USDT 0,062 $Current Support 0,02100 is strong , If it keeps the momentum and the volume,then the expected pump will be around 0,06$

MORE THAN 1000% IN THIS WAVEtp on the chart
evry thing drown on tthe chart
using fractal to analysis

#ONE: Expanding Blockchain Scalability & AdoptionDescription:
This trading idea focuses on ONE, the native token of the Harmony blockchain, which is designed to address scalability issues while maintaining security and decentralization. Harmony employs sharding technology to enable fast, low-cost transactions, making it an attractive platform for developers building decentralized applications (dApps) in areas like DeFi, gaming, and NFTs. ONE plays a crucial role within the ecosystem, facilitating transactions, staking, and governance. Harmony's emphasis on interoperability and partnerships with leading blockchain projects further solidify its long-term growth potential.
Despite these strong fundamentals, the cryptocurrency market is highly volatile and influenced by external factors such as regulatory developments, technological advancements, and market sentiment. Investing in ONE requires careful consideration of these risks and the implementation of sound risk management strategies.
Disclaimer:
This trading idea is for educational purposes only and should not be considered financial advice. Cryptocurrencies like ONE are highly speculative and carry significant risks, including the potential loss of your entire investment. Always conduct thorough research, evaluate your financial situation, and consult with a professional financial advisor before making investment decisions. Past performance is not indicative of future results.

Harmony (ONE)Harmony is a blockchain platform designed to facilitate the creation and use of decentralized applications. Harmony achieves scalability and increases the speed of transactions and block generation through the use of random state sharding. Random state sharding allows the network to split the database into smaller partitions called shards to reduce latency.
Anyway, It is clear that after ONE's harmonic pattern ended, an upward move started but lacked momentum. So, ONE went further down to accumulate momentum, and after did so, a strong upward wave started, and now it seems breaking the minor downtrend line too. Looking at the chart, it can be seen that ONE has a lot of room to rise. Let's see what happens.

Fly ONE fly....What i see it a huge sign of recovering that is hidden in this chart, do you see it also?
This coin has alot of potential and is on the top coin market, watch out for ONE...
It's gonna be a ONE hell of a ride....
THIS IS NOT A FINANCIAL ADVICE, PLEASE INVEST AT YOUR OWN RISK

One / UsdtBINANCE:ONEUSDT
** LSE:ONE / USDT - Update** 📊:
The price has successfully **confirmed a 145-day range breakout** and **retest** ✅. This is a significant move, signaling that the market may be ready for further upside. The price action looks **strong** once again, especially when paired with **Bitcoin**. 💪
As long as prices remain **consolidating above the POC point** (Point of Control) at **$0.1350**, we can expect **another leg up** 📈. This consolidation above the POC indicates that the market has established support at this level, and buyers are stepping in to maintain the bullish momentum.
### **Potential Price Move** 🚀:
From the current price zone, we could see a **40-45% pump** in price 🔥. This is a solid potential gain as the market continues its upward trajectory. However, patience is **key** ⏳. We need to wait for the right setup and confirmation before taking any action.
### **Important Note** ⚠️:
I strongly recommend **avoiding high leverage** 📉, as it can lead to **significant losses** if the market moves against you. Instead, **swing positions** with proper risk management are the way to go for those looking for bigger gains in the longer term. Keep a watchful eye on the trend and be prepared for opportunities without the need for over-leveraging.
### **Key Takeaways**:
- A **145-day range breakout** and successful **retest** indicates strength ✅.
- As long as prices **consolidate above $0.1350**, another upward move is likely 📈.
- **40-45% pump** expected from the current price zone 🔥.
- **Patience is key** ⏳. Avoid **high leverage** to protect your capital ⚠️.
- **Swing positions** are recommended for steady gains 🚀.
**You know my lines!** 📏🚀
*Disclaimer*: This is **not financial advice** ⚠️. Always do your own research and manage your risk accordingly before making any investment decisions. 📊💡
Trading opportunity for ONEUSDTBased on technical factors there is a Buy position in :
📊 ONEUSDT
🔵 Buy Now
🪫Stop loss 0.01350
🔋Target 1 0.01700
🔋Target 2 0.01950
🔋Target 3 0.02200
💸RISK : 1%
We hope it is profitable for you ❤️
Please support our activity with your likes👍 and comments📝


Harmony, ONE, Golden pocket sets up 100x algo targetdecent setup, doesn't get much better than this. this is why we got into crypto, these asymmetric risk to reward plays. bet $1000, worst case you lose it all, best case $100k...
a lot of people were excited about ONE last cycle... Are they still in the game?
See linked BTC chart for why my charts are so bull.
The Trade:
Preferred Entry: $0.0107 or a 0.168 retrace of this impulse wave (if we get one)
Ape Entry: $0.014
Stop: $0.01
Resistance: $0.08917 - bear golden pocket + $0.119 order block.
Target: $1.47
D.Y.O.R. DO NOT BLINDLY TAKE THESE TRADES.
Never Trust. Verify. PLEASE DO YOUR OWN ANALYSIS.
This is not financial advice. These are just my observations.
Technical Analysis is not about being right, it's about increasing your odds.
Be prepared to be wrong. Risk management is key. Capital preservation above all else.

HARMONY ONE - TRADE PLAN + TECHNICAL ANALYSIS Technical analysis and trading plan for Harmony (ONE) cryptocurrency.
Technical Analysis
Ascending Channel: The price is moving within an ascending trading channel, indicating a bullish trend. This channel provides both support and resistance levels.
Current Resistance Levels:
Primary resistance is around 0.01528. A break above this could signal further bullish momentum.
Secondary resistance around 0.01800, which aligns with the upper limit of the anticipated channel and is a key psychological level.
Support Levels:
Immediate support is around 0.01363, providing a cushion if the price retraces.
Additional support is observed at 0.01287, acting as a lower boundary if the bullish channel is broken.
Volume Analysis:
The volume appears to be increasing alongside upward price movement, which is typically a positive sign for sustaining bullish momentum.
Indicators:
VMC Cipher B: Shows bullish divergences, supporting further upward movement. However, a close eye on divergences is necessary to anticipate potential trend reversals.
RSI: Currently around 63.64, indicating a mildly overbought condition but with room for further upside.
Stochastic Oscillator: Around 69.85, approaching overbought levels; this could signal a short-term pullback.
HMA (Hull Moving Average): The histogram is neutral to slightly bearish, suggesting caution as momentum could slow down.
Trading Plan
Entry:
Consider entering a long position if the price holds above the current support level of 0.01363 and begins to show upward momentum.
Alternatively, an aggressive entry can be made if the price breaks above 0.01528 with a retest, confirming a bullish continuation.
Targets:
First Target: 0.01528 (short-term resistance).
Second Target: 0.01800 (upper boundary of the ascending channel).
Stop-Loss:
Place a stop-loss slightly below 0.01363 if entering at this level or at the lower boundary of the ascending channel.
For a more conservative stop-loss, consider 0.01287 as a threshold, indicating a potential trend reversal if breached.
Exit Strategy:
Consider partial profit-taking at the first target level to secure gains, and adjust the stop-loss to break-even to manage risk.
If the price reaches the second target and there is no sign of bearish divergence or weakening volume, hold a portion of the position for further upside.
Risk Management:
Manage position size to ensure the risk per trade does not exceed your pre-determined threshold.
Regularly monitor the volume and indicators (especially RSI and Stochastic) for signs of a potential reversal.
This analysis suggests that while Harmony (ONE) is in a bullish channel, careful attention should be paid to the resistance levels and indicators to manage potential pullbacks.

ONE ONE ONE I'm oneching you!Just like AXS, An accumulation schematic is present in this asset! And the idea is technically the same as AXS where we take advantage of the accumulation schematic.
This asset is stronger as as I am writing this idea, we are approaching a level of interest on ONEBTC.
What's the idea?
We have made a suspected spring and we have went back into the range, locally we also are inside value range so why am I targetting an entry of 0.0105?
This setup aims to snipe the snipest of the low. On my last RUNE setup which catched the low before pumping 28% right up, it was just a weekly open/close along with a local VAL
The same idea is to be applied here. WE have a retest of acceptance into the the whole accumulation range's value and LOCALLY, we are in the midst of the value range but momentum is to the downside.
Logically, the highest probability of the pivot is the price of 0.01191. It is a monthly open/close. local POC.
But hey, if a wick goes to the downside 4% is an easy feat on the crypto
(0.01191 to 0.0105 is about 4%)
This idea aims to catch that falling knife.
so if I go quiet for a few months, know that my hands are still recovering from the wound.

Oneusdt Buy opportunityOneusdt is displaying a double bottom pattern following a substantial correction, signaling a potential major reversal.
Moreover, the price has recently breached above a significant downtrend trendline and is maintaining stability above it.
The designated re-accumulation area presents a favorable buying opportunity. Target levels have been indicated on the chart for reference.
We welcome your insights and opinions on this coin.
Thank you.

HARMONY ONE TECHNICAL ANALYSIS AND TRADE PLANE BY BFTechnical Analysis (4-hour chart) + TRADE PLAN by BF
Pattern Identification:
Falling Wedge Formation: The price is moving inside a falling wedge, typically considered a bullish reversal pattern. The wedge has defined support and resistance lines converging as the price moves downward, indicating potential upcoming breakout to the upside.
Key Support and Resistance Levels:
Support Level: Around $0.01287, highlighted as a solid base where buyers have historically stepped in.
Resistance Level: Around $0.01528, marking a level where sellers may become more aggressive. This is a significant target if the wedge breaks to the upside.
Volume Analysis:
The volume seems to have been decreasing as the price has been moving within the wedge, which is common before a breakout. A surge in volume will be a strong confirmation of any potential breakout.
Indicators:
VMC Cipher_B Divergences: There are green dots visible at the bottom, indicating possible bullish divergences. These divergences suggest price momentum weakening on the downside, aligning with the falling wedge’s bullish potential.
RSL (Relative Strength Level): The current value is 38.54, below the neutral 50 mark, which indicates bearish momentum. However, it's near the oversold territory, and any uptick from here could support a reversal.
Stochastic RSI: At 5.65/8.79, indicating that the asset is in an oversold condition. This adds to the potential for a bullish reversal once the stochastic begins to turn upwards.
HMA+ Histogram: The current histogram shows a shift toward a neutral or slightly bullish sentiment. The transition from red to green would be a strong indicator to enter long positions.
Time and Potential Breakout Catalyst:
There is a clock icon indicating a potential timing window, which may suggest that the breakout could be imminent. The combination of indicators and the falling wedge pattern suggests that a bullish move could be expected soon.
Trading Plan:
Long Scenario:
Entry Point: A breakout above the wedge's resistance line and a confirmation above $0.01365 with a strong increase in volume.
First Target: $0.01528 (immediate resistance level). This would likely be a conservative target as it corresponds to previous highs and the upper boundary of the range.
Second Target: If the momentum continues strongly, the price could test the next level near $0.01600.
Stop Loss: Place a stop loss below the current support at around $0.01250, to limit downside risk in case of a false breakout.
Short Scenario (Alternative if Breakout Fails):
Entry Point: If price breaks down below $0.01287 and volume increases on the downside.
Target: Look for a decline towards $0.01200, which is a psychological round number and could act as support in a bearish scenario.
Stop Loss: Above $0.01350, as a recovery above this level could negate the bearish breakdown.
Risk Management:
Risk no more than 1-2% of your trading capital per trade.
Wait for clear confirmations such as volume spikes or candlestick pattern validation before entering trades.
Harmony (ONE) is showing signs of potential bullish reversal with the falling wedge pattern supported by multiple indicators pointing towards oversold conditions. However, waiting for a breakout confirmation is essential before entering long positions. Proper risk management and trade discipline should be applied to navigate potential volatility.

#ONE/USDT
#ONE
The price has broken the descending channel on the 1-hour frame. Up and is expected to continue
We have a trend to stabilize above the moving average 100 again
We have an upward trend on the RSI indicator that supports the rise by breaking it upwards
We have a support area at the lower limit of the channel at a price of 0.01137
Entry price 0.01190
First target 0.01296
Second target 0.02422
Third target 0.01525

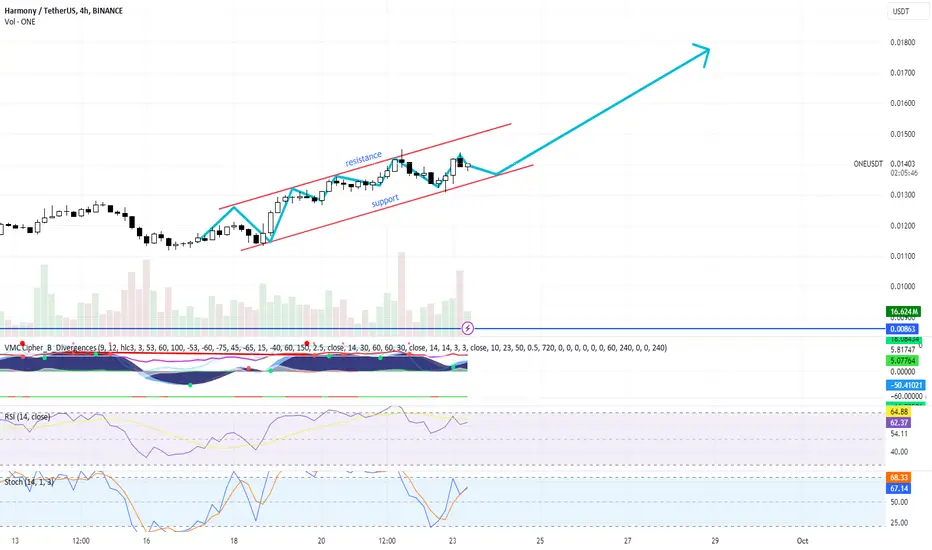
Harmony one is going up! Technical analysis + trade plan by BFChart Overview
Timeframe: 4-hour (Binance Exchange)
Price as of Analysis: $0.01346
Volume: 3.744 million ONE
Formation: Falling Wedge pattern
Chart Patterns and Indicators:
Falling Wedge:
A falling wedge pattern is typically a bullish reversal pattern, indicating that the current downward trend is weakening and a potential breakout to the upside could follow.
The narrowing of price action shows a decline in both support and resistance levels, with lower highs and lower lows.
The breakout is anticipated above the wedge resistance, potentially marking the beginning of an uptrend.
The VMC Cipher B indicator is similar to the MACD and shows signs of bullish divergence, meaning that while the price has been declining, momentum is building for a potential reversal.
The RSI is hovering around 50.25, which is neutral but can indicate momentum is shifting. If RSI starts increasing above 55, it will confirm bullish momentum.
Stochastic Oscillator is currently at 35.30, this shows the asset is near the oversold zone but still in neutral territory. A move above 40 may confirm a bullish trend reversal.
The HMA histogram shows early signs of turning bullish as the color changes and bars are in the process of shifting positive.
Volume has decreased over the wedge formation, which is typical of such patterns. An increase in volume after the breakout will serve as confirmation for a stronger upward move.
Potential Price Targets:
Immediate Resistance: $0.01360 - This is the wedge resistance. A breakout above this level confirms the pattern.
First Target: $0.01550 - Based on previous price levels, this area is the next resistance once the breakout occurs.
Second Target: $0.01750 - This aligns with the previous significant high and could be a target after the first resistance.
Risk Factors:
Stop-Loss: It’s crucial to place a stop-loss below $0.01200 (below the previous support levels) to manage risk in case of a false breakout.
Volume Confirmation: Ensure that the breakout occurs with significant volume, as low-volume breakouts may lead to a reversal back into the wedge.
Trading Plan
1. Entry:
Enter a long position after a confirmed breakout above the $0.01360 resistance with strong volume confirmation. A 4-hour candle close above this level should confirm the breakout.
2. Stop-Loss:
Place a stop-loss slightly below $0.01200 to manage the downside risk in case the falling wedge pattern fails and the price reverses.
3. Profit Targets:
First Target: Set a take-profit around $0.01550 to capture the first major move after the breakout.
Second Target: For those with a higher risk appetite, target $0.01750, which aligns with the next resistance.
4. Position Size:
Risk only 1-2% of your trading capital on this trade. Given the potential volatility and the falling wedge pattern, it's essential to manage position size conservatively.
5. Monitoring:
Keep an eye on the volume and the RSI/Stochastic Oscillator. If RSI rises above 55 and Stochastic confirms the upward movement, the breakout should gain more strength.
Monitor for any potential fake breakouts. If the price fails to close above the resistance on the 4-hour chart, consider delaying the entry until clear confirmation is given.
The Harmony (ONE/USDT) chart is showing a potentially bullish falling wedge formation, indicating that a reversal from the recent downtrend could occur soon. A breakout above $0.01360 with confirmed volume is crucial for confirming the uptrend. If confirmed, Harmony could target $0.01550 and $0.01750 in the near term, but it's important to employ tight risk management through proper stop-loss placement.

Technical analysis and trading plan for the ONE/USDT by BFTechnical analysis and trading plan for the ONE/USDT 1-hour chart (on Binance) by Blaž Fabjan
Descending Trading Channel:
The price is currently moving within a descending trading channel, with lower highs and lower lows. This is a bearish pattern but can lead to a bullish breakout when the price breaks the upper boundary (resistance line).
The price is testing the upper boundary of the channel, which, if broken, could signal a potential upward movement.
Resistance Line:
A key resistance line is visible near 0.0120 USDT. The price has struggled to break above this level in previous attempts.
A breakout above this level with significant volume could signal a trend reversal and potential bullish momentum.
Indicators:
VMC Cipher B Indicator: Showing potential bullish momentum building up as the red momentum wave has bottomed out, signaling a possible trend reversal.
RSI (Relative Strength Index): Currently at 54.30, indicating that the market is neutral but leaning slightly bullish. It’s above the 50 line, which suggests a shift from bearish to bullish sentiment.
Stochastic RSI: Near the overbought zone, sitting at 84.47. This could mean that there might be a small correction before the price pushes higher.
HMA+ Histogram: Shows neutral sentiment, suggesting no strong trend currently. But with a bullish setup on other indicators, this could shift positively.
Volume:
Volume is moderate at 1.879M, and increasing volume during the breakout would provide confirmation of upward movement.
Trading Plan:
Bullish Scenario (Breakout Trade):
If the price breaks out above the resistance level of 0.0120 USDT with an increase in volume, this could signal a strong move upward.
Entry Point: Buy at the breakout above 0.0121 USDT with confirmation (strong bullish candle close above the resistance line and higher volume).
Target 1: 0.0140 USDT (short-term resistance).
Target 2: 0.0150 USDT (next major resistance).
Stop Loss: Set a stop loss below 0.0110 USDT (below the previous low and support of the descending channel).
Bearish Scenario (Rejection at Resistance):
If the price fails to break above the 0.0120 USDT resistance level and reverses, it could move back into the descending channel.
Entry Point: Consider shorting if the price rejects the resistance and starts to move lower, below 0.0118 USDT.
Target 1: 0.0110 USDT (previous support level).
Stop Loss: Above 0.0122 USDT (in case of a sudden bullish breakout).
Consolidation Scenario:
If the price consolidates between 0.0115 - 0.0120 USDT, wait for a clear breakout either upwards or downwards before entering a trade.
Risk Management:
Consider using a risk-reward ratio of at least 1:2 for your trades.
Position sizing should be managed to avoid overexposure. Only risk a small percentage of your portfolio on each trade.
This plan provides both bullish and bearish scenarios, with specific entry, exit points, and risk management strategies. Always ensure you monitor the price action and volume to confirm breakouts or rejections.

ONEUSDTONE ~ 1W
#ONE Back to retesting this support block. if you have Conviction on this coin,. Maybe placing a purchase here is good enough for the short term at least 20%++

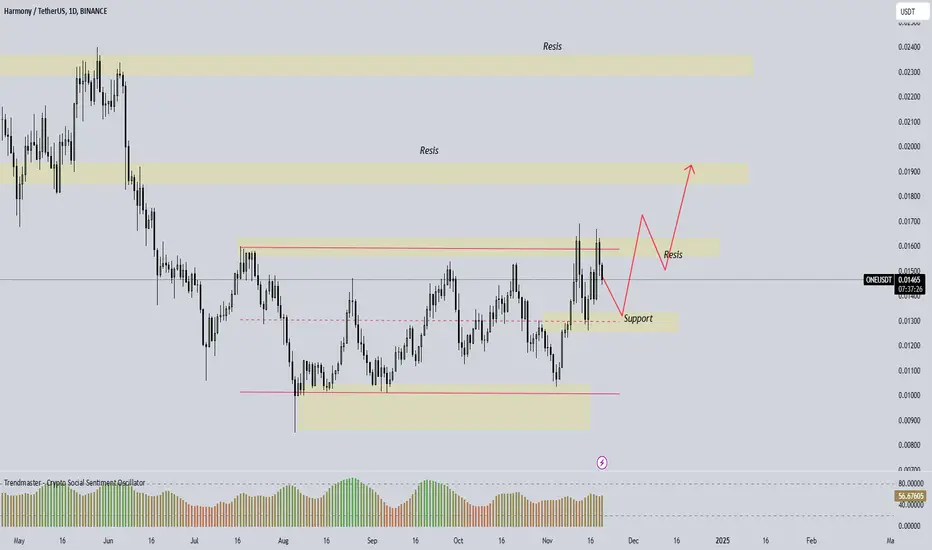
Harmony (ONE/USDT) technical analysis and trading plan.Harmony (ONE/USDT), technical analysis and trading plan by Blaž Fabjan:
Price Channel:
The price is moving within a rising channel, marked by support and resistance lines.
The price is currently near the lower part of the channel (support zone), which suggests potential upside movement if the support holds.
Volume:
There's a visible increase in volume, especially around the recent moves to the downside. This could indicate some volatility and buyer/seller activity.
Keep an eye on whether the volume increases near the support area for a confirmation of buying interest.
Indicators:
VMC Cipher B Divergences:
The green dots at the bottom may suggest some bullish divergence, meaning that the price could bounce from this support level.
RSI (Relative Strength Index):
RSI is around 50, suggesting the market is neutral but possibly gearing up for a momentum shift. A move above 60 could confirm bullish strength.
Stochastic RSI:
Stochastic RSI is currently near oversold levels (below 20) and showing signs of a potential upward crossover, which usually signals a buy opportunity.
Support & Resistance:
The support line of the ascending channel acts as the immediate buy zone.
Resistance is around the upper channel limit, which could be a take-profit target.
Upward Projection:
The blue arrow shows a bullish trend, with price potentially moving upward toward the resistance of the channel.
If the price breaks above this channel, we could see further bullish continuation.
Trading Plan:
Entry Point:
Consider entering a long position near the support line (around $0.0135–$0.0140) within the price channel.
Look for confirmation signals such as increasing volume and bullish divergence on the indicators (especially RSI moving above 50 and Stochastic RSI crossover).
Take-Profit Targets:
Target 1: At the resistance line of the channel around $0.0160–$0.0165.
Target 2: If price breaks above the channel, set an additional take-profit around $0.0180 as indicated by the upward projection.
Stop Loss:
Place a stop-loss just below the channel’s support, around $0.0130. This level ensures protection against a breakdown of the current uptrend.
Risk Management:
Use proper position sizing, risking only 1–2% of your capital per trade.
Trailing stop-loss could be employed if the price continues to move in your favor.
Watch for Confirmation:
Ensure RSI and Stochastic RSI both signal momentum shift, and volume should accompany any move upwards for confirmation of the trend.
By following this technical setup, you can navigate the current market conditions for Harmony (ONE/USDT) efficiently.
ONE SETUPBased on the provided chart for **ONE/USDT** (Harmony on Binance) on a 1-day timeframe, here is a detailed trading plan:
### Entry Points
- **Primary Entry**: 0.01354 USDT (38.2% Fibonacci retracement)
- This is the ideal entry level where the price is showing some consolidation and potential upward movement.
- **Secondary Entry**: 0.01215 USDT (88.6% Fibonacci retracement)
- A lower entry for additional accumulation if the price drops, still within a strong support zone.
### Target (Take Profit) Levels
- **First Target (TP1)**: 0.01663 USDT
- This target aligns with the 61.8% Fibonacci retracement, which is a common area of resistance where traders may take profits.
- **Second Target (TP2)**: 0.02200 USDT
- A more extended target that reflects a potential breakout above the resistance level.
- **Third Target (TP3)**: 0.02800 USDT
- This would be a significant rally target if the price continues to move upwards, aligning with a key resistance zone.
### Stop Loss
- **Stop Loss**: 0.00795 USDT
- Set below the recent low (1.0 Fibonacci level), ensuring a reasonable risk management strategy if the trade does not move in your favor.
### Key Levels and Observations
- **Fibonacci Levels**:
- 38.2% retracement at 0.01354 USDT.
- 61.8% retracement at 0.01663 USDT (TP1).
- 88.6% retracement at 0.01215 USDT (secondary entry).
- **Harmonic Pattern**: A potential bullish harmonic pattern suggests that the price could reverse and move upwards.
- **Volume Profile**: There’s an increase in volume around the current price levels, which might indicate an accumulation phase before a breakout.
### Technical Indicators
- **RSI & MACD**: While not shown on the current chart, the structure suggests that the price might be at the end of a bearish phase, indicating the start of a potential bullish reversal.
### Trade Plan Summary
1. **Enter** the trade between 0.01215 USDT and 0.01354 USDT.
2. **Set Stop Loss** at 0.00795 USDT to limit downside risk.
3. **Target Levels**:
- **First Target (TP1)** at 0.01663 USDT.
- **Second Target (TP2)** at 0.02200 USDT.
- **Third Target (TP3)** at 0.02800 USDT.
This trading strategy is designed to take advantage of the potential upside, while managing risk with a defined stop loss level. The trade relies on Fibonacci retracement levels and the harmonic pattern formation for key decision-making points.

#ONE/USDT#ONE
The price is moving in a downtrend on the 4-hour frame and is about to break upwards
We have a trend to stabilize above the moving average 100
We have a downtrend on the RSI indicator that supports the rise by breaking it upwards
We have a major support area in green at a price of 0.01120
The price rebounded from it
Entry price 0.01150
First target 0.01238
Second target 0.01313
Third target 0.01400
