$ONT, trying to flip the resistance in supportWelcome everyone to my trading idea.
Feedback is always welcome. Please leave a comment!
Disclaimer:
It's my personal vision. This idea does not provide the financial advice.
ONTBTC trade ideas

ONT/BTC Ready with 250% Bullish PotentialONTOLOGY/BITCOIN
Current Price = 0.0000221
Take profits and stop loss have been mentioned in the above chart
Pump Potential = 250%
Period = 30 to 60 Days
You can take an entry in it for a very good ROI
Technical Analysis
1. ONT/BTC Breaks its very huge Descending Channel
2. For Bullish confirmation it makes a symmetrical triangle
3. Bullish divergence at RSI
4. Golden Cross (50EMA Cross Over 200EMA at 4H Chart)
5. Trading above 200EMA at 4H Chart after a long time
6. Trading above 50 at RSI
7. Retest From All Time Low
Thanks & Happy Trading

ONTBTC possible scenario for long!! ıt is about the complete the H&S. Patience is the key to Ontology. If you catch it on that green line buy and forget it!


Ontology (ONT) Bullish After A Short WaitWe looked at Ontology (ONTBTC) 6 March and the chart today stays the same... We are just seeing it develop.
We have a bullish setup, a falling wedge, and prices moving back above EMA21, EMA10, EMA50, and beyond.
The next target is marked on the chart, ONTBTC is surely to grow.
Notice how the other altcoins are moving, expect to see big green candles here, each altcoin pair will have its turn.
Enjoy the profits as they come.
Always diversify...
Play safe.
Thanks a lot for reading.
Namaste.


The Best Chart for ONT Hi guys i hope u enjoy thin chart
i analysis for only Spot (Hold)
we have a lot of reason for this analysis
First : close candels on (Kumo) in daily time frame
second : all candles under SMA 200 so finally we cross this line
untill SMA 200 is first TP for us after that we go to the moon


Ontology (ONT) With Full Trade Signal InsideOntology (ONTBTC) is looking great and doing better each day.
We have a new uptrend forming with bullish indicators, this pair can start to move strongly soon.
Here you can find the full trade which already hit the first target:
You can find additional details on the chart or visit the previous trade idea for ONTBTC for the trade numbers.
Thanks a lot for your support.
Namaste.

Ontology Trade Signal (125%+ Potential) & More...ONTBTC
ENTRY: 0.0000175 - 0.00000195
TP1: 0.0000220
TP2: 0.0000245
TP3: 0.0000265
TP4: 0.0000315
TP5: 0.0000355
TP6: 0.0000430
STOP: Close daily (D) below 0.0000175.
---
Prices don't necessarily need to go up just because we have some chart signals or we jump into a trade, the market can move in any direction and it is always open to change.
So, even though we have the setup, the experience, and great results when we trade, we use a stop-loss because we know that the trend can change in direction at any time, any day.
We have a great potential for profits but there are also risks involved when we trade.
Make sure to do your own research.
It is your hard-earned money.
This is not financial advice.
Thanks a lot for your support.
Namaste.


Diamond Indicator Sig2 KUCOIN:ONTBTC TradeDiamond Indicator v8 - Sig2 KUCOIN:ONTBTC Trade
Trading using webhooks with Cryptohopper -> www.cryptohopper.com
Position opened 03/01/2021 12:00:35 AM for 0.00001836BTC
Position closed 03/01/2021 8:08:31 AM for 0.00001863BTC
1.47% trade
** Do your own research when trading. Do not trade what you cannot afford to lose. This is for information only and represents real trading using the custom Diamond Indicator.

ONT LongLooking like its printed a higher low so far, with good volume. Will be looking to buy breakout of diagonal downtrend


Accumulation of bullish alarmsGiven the breaking of its own dynamic RES zone and the formation of a bull flag, we are now ready for the ONT to grow again.
Also, the events related to the upgrade of its own network have created a positive atmosphere for this coin.


Crypto|ONT/BTC|LongLong ONT/BTC
Activation of the transaction only when the blue zone is fixed/broken.
The idea is to work out the resistance level .
* Possible closing of a trade before reaching the take/stop zone. The author can close the deal for subjective reasons, this does not completely cancel the idea and is not a call to the same action, you can continue working out the idea according to your data, but without the support of the author.
+ Maybe right now we will go even lower, then it's okay, the idea is not activated and simply canceled.
The "forecast" tool is used for more noticeable display of % (for the place of the usual % scale) of the price change, I do not put the date and time of the transaction, only %.
Blue zones - activation zones.
Green zones - take zones.
The red zone - stop zone.
Working out the stop when the price returns to the level after activation + fixing in the red zone.
Orange arrow - the direction of take.
Blue arrow - neutral scenario without activating the trade.
The red arrow - the direction of the stop.
SUM PNL: This parameter displays the total % of all closed ideas of the "new" format (according to the author) for this sector at the time of publication of the idea. The calculation is very "clumsy" just the sum of the profits of all the ideas, based on this indicator, you can more accurately assess the risks when working with my ideas of this sector. I present you the construction of the idea, you can use it yourself as you like based on your subjective view and risks, the calculation of the PNL indicator is carried out only on transactions that the author closed on TV in manual mode or by take.
P.S Please use RM (risk management) and MM (money management) if you decide to use my ideas, there will always be unprofitable ideas, this will definitely happen, the goal of the system is that there will be more profitable ideas at a distance.

ONT/BTC Mid term chartONT/BTC pair still in the bottom I think like a top project it will pump hard and cross 2.5 dollars in near future.

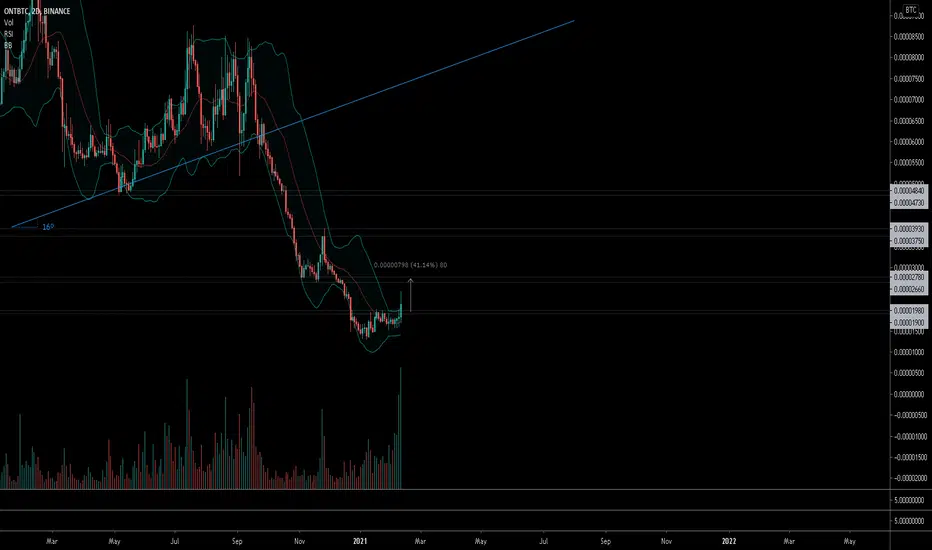
$ONT, Signalling a 2D buy with really strong volume$ONT
Signalling a 2D buy with really strong volume not seeing since 2018..
In comparison with other alts, this one has move very little from the bottom level
Also bb bands look ready for a breakout..
Aiming for ~3500/5000 sats as targets seems easily achievable..
#ONT

Ontology (ONT) Consecutive Green Candles Before Boom!This is exactly what you see before a massive jump, we have multiple green candles showing up for ONTBTC... This is a strong bullish signal.
Anytime, we can see prices jump and the yellow boxes (targets).
This is not financial advice.
You still need a well-developed plan/strategy before trading.
Patience is also required.
Namaste.
