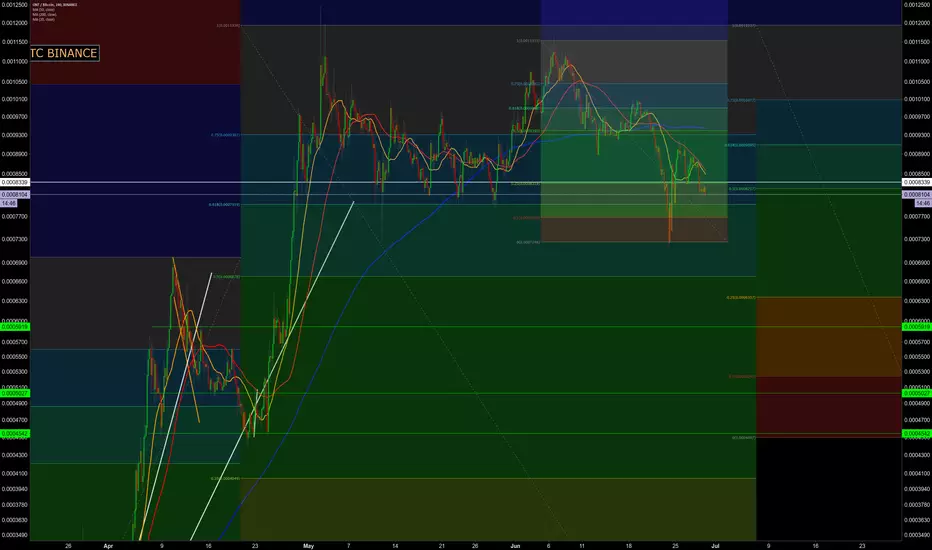
ONT - Free SignalYellow = Buy Zone
Green = Sell Targets
Red = Stop Loss
To play this trade from a safer standpoint you may want to wait for a bull cross on the stochastic or TRIX.
ONTBTC trade ideas

Respect my Cocoline ONT!Helly everybody,
Just an update on ONT. As you can see ONT dropped a lot since my recent post. We arrived at the 0.5 fib line. Either we move upwards for a slight correction or ONT will fall massively towards 5500 sat levels. The last option would be nice, because I kinda missed out on the first run, dammit.
But as we all know, what goes up must come down and nothing stays up forever right;) My buy-zone would be even lower, but hey, I have coco balls of patience:) Hope you as well.
Peace & Love


ONT under pressure ?It's most likely to hit 5173 ( more or less )
If not .. It must breakout the green lines to confirm new ATHs
Red lines are supports
Some scenarios on the chart
Good luck


ONTBTC short term Long pullback to EMA
ONTBTC
A bit weak Bullish Divergence on MACD-H (a bit more then 50% )
Strong Bullish Divergence EFI
RSI touched oversold zone
Then there is a false breakout, the new low has formed for now.
I expect it to go up to the slow EMA
Entry 0.0007330
Target 0.0007478
Stop Loss 0.0007250
R/R ratio: 1:2
How I got my entry at 0.0007320 :

ONT good opportunity to buy
ONT/BTC is once again testing the Low Trend Line channel and is approaching the support of 7240 sats, a point type for purchase. If this support is not respected, we have another below in 6800 sats.
- RSI is entering the oversold zone.
- Stochastic Oscilator is indicating oversold, which indicates that soon we will have a jump in price.
Ps: Remember. Your trades, your risks, your responsibility.
Gratitude and good trade

ONTOLOGY(ONT) WAITING FOR A BREAKOUTOUTLOOK: BULLISH BIAS
Ontology is currently top 22 in coinmarketcap and top 15 in the past 24hr volume.
>7520 sats has been holding the price and tested multiple times in 4hr time frame and twice in daily.
>ONT is very attractive since it didn't pump that much since the price up tick in BTC un like other top 30 tokens & coins
>Same with MANA that pumped behind from top alt coins.
>In 1hr, 4hr & 1D time frames, all indicators are showing exhaustion from sellers and price might go up any time soon.
>A candle close above 7800 sats, above the EMA7 & upper trend line will confirm a bullish breakout
>Candle close below 7480 sats will push the price down to 7200 which is most probably the bottom
>RSI, Stoch RSI, BB%B & MACD is showing a good consolidation at the bottom waiting for a breakout.
>RSI is currently flat despite of a trending down of the price which could be a sign of a reversal.
>Waiting for a candle close for a confirmation.
>30% up is very probable
**Disclaimer;
>This is still a novice work and definitely not a financial advice.
**Comments and constructive criticism will be fully appreciated so I can improve more with my TAs. Thanks for checking my work!

ONT Retests Bottom of Channel, Descending Triangle FormingONT has reached the bottom of the channel it has more or less remained in since early May. Daily RSI is in the mid 30's, which is a very weak area, with a bearish divergence. Price action has also fallen below the daily Ichimoku Cloud and is forming a bear triangle. The 4 HR chart looks more appetizing, with Stochastic RSI reaching oversold levels. There may be a quick play to be made here, however, I will not be entering this trade. If you decide to take a position, I would recommend buying near market value, with a stop-loss no lower than 0.00071.

ONT Daily Timeframe Update 7/4 Still haven't changed my targets,I'm thinking this is a extended/complicated wave 3/4... wave 5 won't be amazing, but the next wave set could be wave "3" (this being the 1/2) and we may see some excellent gains in the coming months to year end.
I'll watch and wait for now.

ONTRequest 5
1D bearish indicators - expect a drop to ~7156 sats before bouncing if support doesn't hold
That will give a nice Bollinger Band pinch
4H RSI starting to pop - Bollinger Band is bearish I can see us hitting ~7700 but not sold on it -
We need to break the trendline which is going to be tuff given the indicators
45M alot of pressure at support - indicators are bearish watching to see if support holds
If not we are going down to ~7156 sats

ONTBTC LONG GARTLEY PATTERNThe trend based fib extension on the first bullish gartley(purple, ~june 1st till ~june 24) gave us the 50% extension/retracement on june 25/26 and the start of a smaller second bullish gartley (red, ~24 june till ~3 july). Things are looking good for a breakout on the bearish channel that started around ~june 6.
First primary targets are the 61% on the trend based fib from the second gartley that coincides with the 50% on the trend based fib from the first gartley, around 9k sats.
Second primary target is the 168% on the trend based fib from the second gartley that coincides with the 100% on the trend based fib from the first gartley, around 11k sats.
Depending on your entry, first target is 10 - 15%+ and second target is 40 - 50%+.
Resistance targets could be 9k and 10k sats.
Tight stoploss would be around 7.4k sats, just under low of july 3rd.
Wider stoploss would be around 6.8k sats, just under low of june 24.
Upon reaching profit targets, I expect us to form a bearish gartley (green) and from there on probably retrace atleast 50%.

ONT/BTC 8hr...Many Counts In Play, Finding The Reentry...Hello fellow traders...
Wanted to give an update on Ontology as it has been a while since we made a new post. However, the alarm at 8k has hit, so this is a good time for an update ;-)
Due to a current business venture we are working on, we have decided to switch these charts to an 8hr--as we are diverting our precious time in other areas. Still are longterm bulls on ONT, but as of where we stand currently, there is not enough market data to reenter just yet. Here is one of our proposed counts detailing the overall picture of the setup.
As always, stay tuned for regular updates on the chart and changes to the count.
And please, do not take this as financial advice. It is here for your education and entertainment ;-)
longmoney


ONT CHART TARGET$ONT this time price 0.00080000 btc
$ONT Target
1 0.00084000 btc
2 0.00087000 btc
3 0.00090000 btc
4 0.00093456 btc
5 0.00095432 btc
Must use stoploss at 0.00078661 btc

#ONTOLOGY #BITCOIN #BITCOINPRICE #TRADING #BITDHARMADescending traingle, accordign to the statistics the breakout should be downward.

ONT - Do's and dONT's 4HR chartI feel kind of bad. Almost every chart I am putting out these days seems to have the feeling of sell sell sell and wait for the drop.
Onto ONT. This (chart wise) has been quite spectacular throughout the last 2 months. Holding its sat value of at least 7.9k.
I believe this has a high chance of being over. Not only did the rally up around June 6th fail to break previous highs, but we recently went under our old lows of 7.9k. The moving averages are also looking like poop.
My predictions for the fall (if it does of course which i believe it will) BTC looks horrible after all.
Drop to 6357-6678 with short bounce upwards to 7k-7.25k.
Then drop to 5600-5900 before making an actual attempt to regain its old value. The beautiful thing about a drop to this mid to high 5k range without bounding around at mid 6k, is that there is a lot of open space to encourage buyers to gain profits before we reach our old support of 7.9k. Also this decreases the chance that people who bought at 7.9 will want to sell out before we re-test at 7.9 (the concept of the cycle reaching 7.9 for a final re-test to be over)
I could say more, but it just seems like a waste of time at the moment. If this drops i believe it will most certainly hit 5.6k-5.9k. There is simply too much support at this level and too little in between.
Tl:DR The more lines closer together the better the resistance.
ONT going for a down swing?Last week ONT was in a triangle, to me it looks like it's breaking down.
I'm thinking, in bull case, it could go sideways a bit and extend the triangle.. then move up. But I think it's less probable. ONT had a really good run, made 5 elliot waves, double topped, with the 2nd top done on less steam.. it's kinda expensive to pump more at these prices, besides last season it made ~500% vs BTC, one of top gainers.. mainnet launched.. so maybe it's time for a swing down.
The break of the major support line is bothering..
Symmetrical triangles have ~50/50 chance of breaking up/down, so in case you're long, keep a tight stop.
Mine just got triggered, so I'm stepping to the sidelines to watch this coins and see how it behaves.

ONT // BTC / Patterns BAT-possible rebound in bearish trend lineONT is currently forming a BAT pattern where
first rebound was at 0.78% fibonacci
and possible rebound in support area and reach the long bearish trend line
trading risk
1/1
regards

ont on the uptrend channel
fundamental
30 June 2018 (or earlier)
Mainnet Release
30 June 2018 (or earlier)
ONT ID Release
Ontology distributed identity framework (ONT ID) release.


Ontology [ONTBTC] Ready to Drop OR To Grow ??hey guys
this is my new chart about ONT
as we see 7708 great support maybe we will see bounce from there to 8200-8500
but if we break it ( 7708) down we will see 6800-4500 and it will good time to buy
now its better to wait
sometimes the big signal is no signal (:
click like and follow
and check my telegram channel for more charts

$ONT (ontology) Levelssupports and resistances for $ont.
let me know what do you think about it.
Thanks.
