ONTBTC trade ideas

ONT Pushing forwardWhite Line:
Found a bottom
Retest previous resistance
Retrace forming an upward trend
Breakout from recent resistance
Retest resistance as new support...
Buying.
New thing this week is to stop aiming for tops and bottoms.
Buy some higher lows and keep the trend as your friend.
Small position size while BTC is taking a nap in a range. Alt will suffer when BTC moves so I have a tight enough stop to where we have a little runway to take off before BTC moves.
I would like to get to the top of the range this month but I'm playing what the market gives me, so we'll see what we get.


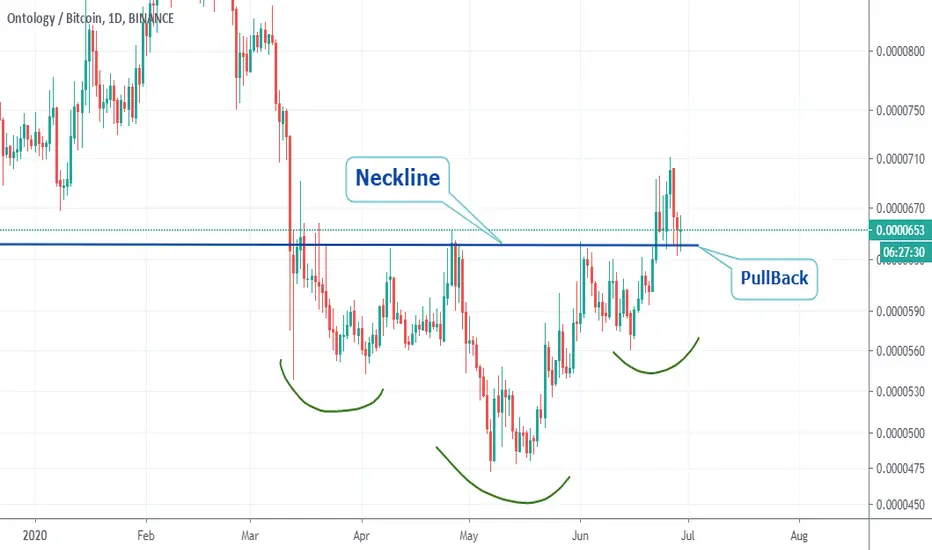
Inverted Head&Shoulders Pullback on ONT Hello Traders,
ONT is forming an Inverted Head&Shoulders and it seems to be confirming this pattern with this pullback to the neckline. If the price goes above yesterday maximum will be a pretty bullish indication that this asset is going up.
Push the like button and follow us on TradingView.
ONT/BTC(weekly), bull div, falling wedge, 50 WMA target, 2XI AM NOT A FINANCIAL ADVISER, DO YOUR OWN RESEARCH!

ONT/BTC, en surveillance d'un achat sur petite correctionONT/BTC, en surveillance d'un achat sur petite correction, idéalement si on teste le bas du canal haussier ce qui correspondrait à une petite meche sous la zone rose (qu'on est breakout auparant et qu'on retest par au dessus en ce moment)

ONTBTC, It's a buy!After multiple rejections from 63x recently it was broken.
We can say it is in the buy zone. after breaking out of 714 (weekly resistance), 0.85k 1k and 1.4k are easy targets for ONT.

WAIT FOR THE RIGHT MOMENTLES THE PRICE TAKES A BREATH, WHIILEE YOU GET READY.
FOLLOW ME IF YOU AGREE.

ONT.BTC (Y20.P3.E1).More to goHi All,
Looking at the recent pullback, and acknowledging that the drop or rise in BTC with these impulses has given us many mini Alt seasons.
So lets make the most of it.
Based on my lines and a breakout from the wedge and a pullback to the 0.5 fib level, can possible allow the flagpole target to be reality.
We still have a nice uptrend formation, one of the better structures for the Alts.
As per the chart, my 1st target is 0.000074 - 0.000075
2nd target, for the inverse H&S, chart below
The only issue I have with this setup is the 2 wicks on the 12 HRLY as it makes the stop limit loss more than I like.
Please give me a like or tick for this post.
Regards,
S.Sari
12 HRLY chart - displaying major levels
As the friend said, a inverse H&S as well as the main target

ONT/BTC #rocketbombquickidea🔥Hello!🧡
Continue a new hashtag #rocketbombquickidea for you🔥🔥
If you like such format of my quick analyzes, support me with like. I'll try to find more opportunities for making 💰
Always in touch with you🧡
Sincerely Your Rocket Bomb🚀💣

ONTBTC, Ready for great growth !!!Ready for a 40% profit!
Hello friends
I have been following ONTBTC for a few days. I think we have a great opportunity for good growth.
Given that the Time frame has cut the MA200 daily and is currently at the top of the cloud, we can easily expect a good growth from ONTBTC.
Target 1: 0.0000801
Target 2: 0.0000909
Target 3: 0.0001051
Stop 1: 0.0000530
Stop 2: 0.0000500
Please trade and sell according to your opinion and discretion
..Navid ..

ONTBTC Trade Inv. H&S| Volume Profile| 200 MA Resistance Evening Traders,
Today’s Analysis – ONTBTC – breaking its neckline zone if it’s Inverse head and shoulders. A retest and hold of the .618 Fibonacci is a long opportunity with defined risk.
Points to consider,
- Macro Inv. Head and Shoulders
- Neckline support (Retest)
- 200 MA Immediate Resistance
- Oscillators Neutral
- Volume Profile in synch
ONTBTC has broken out of its macro bullish pattern; the technical target is in confluence with structural resistance.
The Neckline retest will allow for a long entry with defined risk. The S/L placement logically is at the recent thrust candle.
Retest and hold of the neckline will solidify it as support and further confirm the reversal pattern.
Immediate resistance is the 200 MA, price initially has respected it. Breaking this resistance will be very bullish; reaching the technical target will become more probable.
Both oscillators are neutral in retrospect with the pattern. Trading above the 50 level gives a bullish bias in the market.
The volume profile is in synch with the pattern, the recent volume spike confirmed the neckline break. Volume follow through will be key when reaching the technical target.
Overall in my opinion, ONTBTC has a very clear inverse head and shoulders at play. Retest of the neckline, (.618 Fibonacci), is a valid long entry with defined risk. Breaking above the 200 MA will increase the probability of reaching the technical target.
What are your thoughts?
Thank you for following my work!
And remember,
“Amateurs think about how much money they can make. Professionals think about how much money they could lose.” – Jack Schwager

Ontology (ONT) on the riseHi all,
Looking at ONT as one of the alts that moves pretty nicely these days, we can clearly see a new higher high was printed today at .670. We are also above the uptrend line and there is plenty of room for growth if the we manage to close above this level and consolidate on daily.
Target up:
.690 - very important as this is where the 200-day EMA sits currently.
.710 - which was mainly acting as uptrend support, but still its a level to watch for.
.740
Cheers,

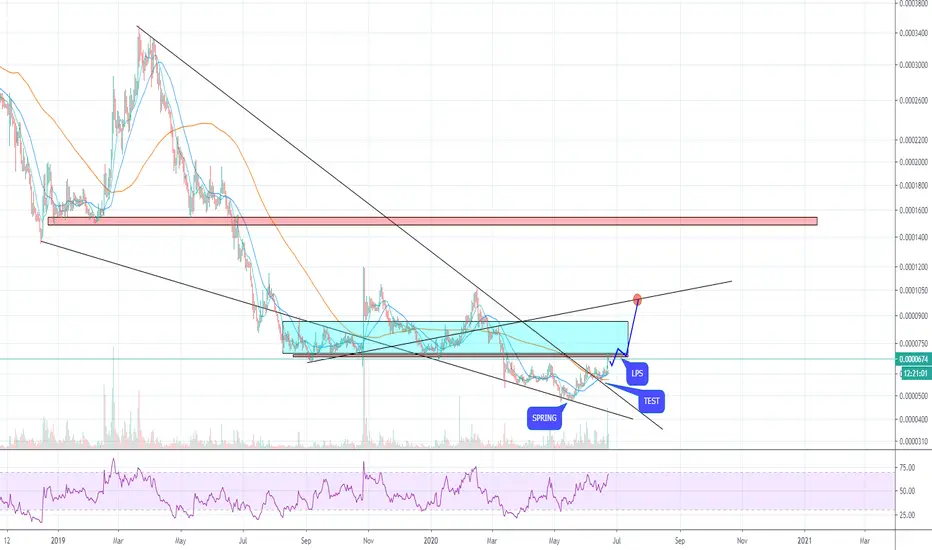
ONT Wyckoff meme chartAnother one to print Wyckoff accumulation chart - up till now at least :)
inverse H&S should help push it a bit more up

ONT/BTC H&S CompletionOntology completed a 14-week H&S. Measured target at .830 #bitcoin #altcoins #classicalcharting

ONTBTCbought at breakout of channel... crossing the ping area could result in an S/R flip with much more room to the upside. Move stops up accordingly

$ONT, Crossing over ~6500 sats w/ nice volume$ONT
Crossing over ~6500 sats w/ nice volume as UCTS turns green across 1/2D and lower timeframes...
Continuation should allow ~7200sats as 1st target while I will be aiming for a retest (flip?) of crossed level as potential entry
#ONT


ONT / BTC Breakout BullishOntology Mainnet 2.0 is June 30th 2020. This should add some bullish sentiment.

Ontology about to ExplodeHello Traders,
Ontology is about to pump. It crossed an importand downtrend line and did an head and shoulder pattern. We recommendo to buy if it cross the ressiatnce level.
