ONTUSDT 1D AnalysisONT ~ 1D Analysis
#ONT This trade is very risky, Buy on retest of this support block or buy after successfully breaking this resistance line with short term target of at least 15%+.
ONTUSDT.P trade ideas

ONT SHORT RESULT Ont price moved fown just as Predicted.
TP Done ✅ 💪🔥👌
After the breakdown of the Ascending support Trendline, price retested the resistance zone and dumped down as predicted.
_THE_KLASSIC_TRADER_.

ONT SHORT SETUP ONT Price has been in trading inside a bigger ascending symmetrical triangle from our 4HTF, until it broke down the support Trendline over the weekend and currently showing signs of successful retest which is where I placed this short setup.
So we'll see yow it goes 💪
_THE_KLASSIC_TRADER_.

ONT ANALYSIS 📊 #ONT Analysis
✅There is a formation of Falling Wedge Pattern on daily chart with a good breakout and retest and currently trading around its support zone🧐
Pattern signals potential bullish movement incoming after the confirmation of retest
👀Current Price: $0.1483
🚀 Target Price: $0.1940
⚡️What to do ?
👀Keep an eye on #ONT price action and volume. We can trade according to the chart and make some profits⚡️⚡️
#ONT #Cryptocurrency #TechnicalAnalysis #DYOR

ONTUSDT 1D AnalysisONT ~ 1D Analysis
#ONT Buy incrementally on retesting this support block with short term target of at least 10%+.

Ontology, Simple 250% Bullish Wave MappedOntology is super bullish now recovering above three major support levels after a new All-Time Low. 7-April, the Cryptocurrency correction and market bottom.
The lows in question are 3-February 2025, August and July 2024. All these were major levels with ONTUSDT trading above them all, before crashing below of course. This is the most bullish a chart can become. Literally the most bullish possible.
A new ATL is hit followed by a strong recovery, with a v shaped bottom. Growth confirmed. ONTUSDT has been moving but very slowly, remember? "Slow and steady growth at first and then bullish momentum grows."
That's one, there was another one; "Bottom prices are available now but soon they will be no more, once they are gone they are gone forever. Today, prices can be low yet the next day, a strong rise and the bottom prices are forever gone."
These are the past few weeks of analyzes in summary.
Another, "Buy now and buy everything as if it is the end of the world."
While the bottom is gone, it is still early to enjoy a huge bullish rise/wave/phase and maximum growth.
» The 250% target is an easy target and there will be much more in this bull market. Prices will go off the chart.
Thank you for reading.
Namaste.

ONT/USDTKey Level Zone: 0.1355 - 0.1366
HMT v8 detected. The setup looks promising, supported by a previous upward/downward trend with increasing volume and momentum, presenting an excellent reward-to-risk opportunity.
HMT (High Momentum Trending):
HMT is based on trend, momentum, volume, and market structure across multiple timeframes. It highlights setups with strong potential for upward movement and higher rewards.
Whenever I spot a signal for my own trading, I’ll share it. Please note that conducting a comprehensive analysis on a single timeframe chart can be quite challenging and sometimes confusing. I appreciate your understanding of the effort involved.
Important Note :
Role of Key Levels:
- These zones are critical for analyzing price trends. If the key level zone holds, the price may continue trending in the expected direction. However, momentum may increase or decrease based on subsequent patterns.
- Breakouts: If the key level zone breaks, it signals a stop-out. For reversal traders, this presents an opportunity to consider switching direction, as the price often retests these zones, which may act as strong support-turned-resistance (or vice versa).
My Trading Rules
Risk Management
- Maximum risk per trade: 2.5%.
- Leverage: 5x.
Exit Strategy
Profit-Taking:
- Sell at least 70% on the 3rd wave up (LTF Wave 5).
- Typically, sell 50% during a high-volume spike.
- Adjust stop-loss to breakeven once the trade achieves a 1.5:1 reward-to-risk ratio.
- If the market shows signs of losing momentum or divergence, ill will exit at breakeven.
The market is highly dynamic and constantly changing. HMT signals and target profit (TP) levels are based on the current price and movement, but market conditions can shift instantly, so it is crucial to remain adaptable and follow the market's movement.
If you find this signal/analysis meaningful, kindly like and share it.
Thank you for your support~
Sharing this with love!
HMT v2.0:
- Major update to the Momentum indicator
- Reduced false signals from inaccurate momentum detection
- New screener with improved accuracy and fewer signals
HMT v3.0:
- Added liquidity factor to enhance trend continuation
- Improved potential for momentum-based plays
- Increased winning probability by reducing entries during peaks
HMT v3.1:
- Enhanced entry confirmation for improved reward-to-risk ratios
HMT v4.0:
- Incorporated buying and selling pressure in lower timeframes to enhance the probability of trending moves while optimizing entry timing and scaling
HMT v4.1:
- Enhanced take-profit (TP) target by incorporating market structure analysis
HMT v5 :
Date: 23/01/2025
- Refined wave analysis for trending conditions
- Incorporated lower timeframe (LTF) momentum to strengthen trend reliability
- Re-aligned and re-balanced entry conditions for improved accuracy
HMT v6 :
Date : 15/02/2025
- Integrated strong accumulation activity into in-depth wave analysis
HMT v7 :
Date : 20/03/2025
- Refined wave analysis along with accumulation and market sentiment
HMT v8 :
Date : 16/04/2025
- Fully restructured strategy logic

ONTUSDT 1WONT ~ 1W
#ONT So far it still maintains its bullish structure. if you still have Conviction on this coin,. Buy from this support block with a minimum target of 20%++

bear flag or upside down cup and handle?
Today the unemployment report in the US, if it is below the consensus, we can shorten it, there are a lot of setups, but I would like something beautiful, like from a textbook))

ONTUSDT (Ontology) Updated till 13-01-25ONTUSDT (Ontology) Daily timeframe range. PA here trying to get out of its consolidation range. 0.2929 is the resistance here confirm close above it can push it above this range. alltho its moving while market is down. recent support at 0.2136.

#ONT (SPOT) IN ( 0.2000- 0.2500) T.(1.6900) SL(0.1905)BINANCE:ONTUSDT
#ONT / USDT
Entry( 0.2000- 0.2500)
SL 1D close below 0.1905
T1 0.3300
T2 0.6100
T3 0.9100
T4 1.6900
______________________________________________________________
Golden Advices.
********************
* collect the coin slowly in the entry range.
* Please calculate your losses before the entry.
* Do not enter any trade you find it not suitable for you.
* No FOMO - No Rush , it is a long journey.
Useful Tags.
****************
My total posts
www.tradingview.com
**********************************************************************************************
#Manta #OMNI #DYM #AI #IO #XAI #ACE #NFP #RAD #WLD #ORDI #BLUR #SUI #VOXEL #AEVO #VITE #APE #RDNT #FLUX #NMR #VANRY #TRB #HBAR #DGB #XEC #ERN #ALT #IO #ACA #HIVE #ASTR #ARDR #PIXEL #LTO #AERGO #SCRT #ATA #HOOK #FLOW #KSM #HFT #MINA #DATA #SC #JOE #RDNT #IQ #CFX #BICO #CTSI #KMD #FXS #DEGO #FORTH #AST #PORTAL #CYBER #RIF #ENJ #ZIL #APT #GALA #STEEM #ONE #LINK #NTRN #COTI #RENDER #ICX #IMX #ALICE #PYR #PORTAL #GRT #GMT #IDEX #NEAR #ICP #ETH #QTUM #VET #QNT #API3 #BURGER #MOVR #SKL #BAND #ETHFI #SAND #IOTX #T #GTC #PDA #GMX #REZ #DUSK #BNX #SPELL #POWR #JOE #TIA #TFUEL #HOT #AVAX #WAXP #OGN #AXS #GALA #ONE #SYS #SCRT #DGB #LIT #QI #FIL #GLMR #ATOM #LTC #MANA #ONT

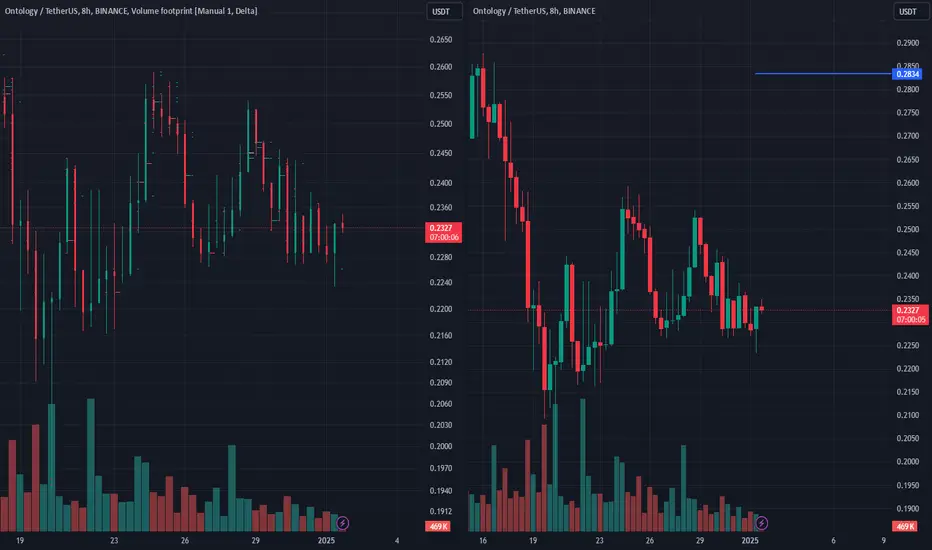
SPOT ONT LONG 1.01.2025
Pinning after containment of sales.
🎯Purpose:
0.2834
‼️Risk per trade: 0.5-1% of the allocated funds for spot trading.
Thank you for follow and the reaction🚀.
SPOT ONT LONG 21.12.2024Fixation after exhaustion of sales.
🎯Purpose:
0.4097
‼️Risk per trade: 0.5% of the allocated funds for spot trading.
Thank you for subscribing and responding🚀.

ontusdtIt formed a triangle formation on the ONT hourly chart. Its target is shown on the chart along with its breakout.

ONT triple bottom, above 3D 200ma, 134% 915% upsideONT triple bottom, Support Resistance flip, broke out of down trend, above the Point of Control, above the 3day 200 SMA and EMA.
134% upside by the end of May. If it happens before that and support resistance flips that level, could see 915% upside. Or if there is a correction after May and it consolidates above 134%, the next thrust after Summer could see previous cycles highs but probably won't.
Alt season started in Feb for ONT last time

ONTUSDT Bullish Breakout ConfirmedONTUSDT Technical analsysi uopdate
ONTUSDT's price has formed a parallel channel pattern at the bottom. The price broke the channel resistance on the daily chart and has completed a retest. It is trading above the 100 EMA and 200 EMA, indicating a potential bullish move in the coming days.
Regards
Hexa

+67% ONT USDTWhat is ONT ?
The Ontology blockchain is a high speed, low cost public blockchain bringing decentralized identity and data solutions to Web3. Increasing privacy, transparency, and trust, the high speed, low cost, layer 2 blockchain is designed to give users and enterprises the flexibility to build blockchain-based solutions that suit their needs, while also ensuring regulatory compliance. Through Ontology’s Ethereum Virtual Machine (EVM), Ontology ensures frictionless compatibility with Ethereum, the first step in the creation of the Ontology Multi-Virtual Machine and further interoperability for the chain.

ONTUSDTONT ~ 1W
#ONT So far it continues to maintain this support block. If you still have Conviction on this coin,. This support block would be a very good buy for now. At least for 20%++


Ont/usdt long positionhi guys today 10/10/2024 I boght ont after observing it this days my analyse said that it will go up so I did go with it with a long position and I want to share it with u
buy : 0,1794
tp: 0,2224
Sl:0,16

ONTUSDT.4Hanalyzing the ONT/USDT 4-hour chart, I notice that the price has formed a significant ascending trendline since the low at $0.1276, suggesting a strong upward momentum. This ascending channel has been guiding the price, providing clear support and resistance levels that have been crucial for my trading decisions.
Currently, the price is nearing a crucial resistance level at R1 ($0.2216), which has previously acted as a pivot point. The interaction at this level is vital because a break above could potentially lead the price towards R2 ($0.2500), a higher resistance level marked on the chart.
The support levels at S1 ($0.1800) and S2 ($0.1500) are also significant. They offer potential buying opportunities if the price retraces, especially if it remains within the ascending channel. A breakdown below S2, however, could negate the current bullish outlook and prompt a re-evaluation of the bullish scenario.
The technical indicators such as the Stochastic RSI suggest an overbought condition, which might lead to a temporary pullback or consolidation. The MACD, still above the signal line but showing signs of convergence, indicates that while the momentum is bullish, it may be weakening or facing resistance.
Given these observations, my strategy involves watching for a potential breakout above R1. Should this occur with adequate volume and the indicators support continued strength, I would consider entering a long position targeting R2. Conversely, a pullback towards S1 or S2, where the price could find renewed buying interest, might also offer a strategic entry point for a long position, especially if the price action suggests a bounce back into the trend channel.

ONT/USDT 15 min TFDaily Structure break, bullish RUN.
4 Hr tf Trend, Bulllish,
15 min bullish,
Price currently on 15 min demand zone,
LONG!
Risking 1% of my account
Stoploss & Tp's Marked.

ONTUSDTONT ~ 1W ✅
#ONT If you have Conviction on this Coin,. Maybe this is a very good buy for now,. At least for a 20%+ profit for Short-term.
