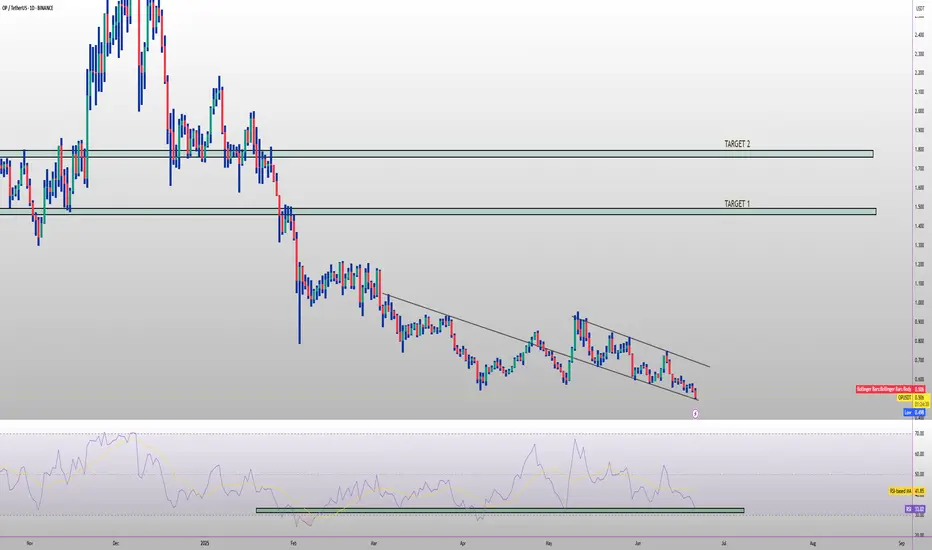
OP TARGETS FOR Q2 2025🔥 NASDAQ:OP long setup (1D) 🚀
✅ Entry Zone: $0.46 – $0.506 (descending-channel base)
🎯 Targets
• TP-1: $1.55 (Nov-23 supply flip)
• TP-2: $1.80 (201-day breakdown block)
⛔ Stop-Loss
Daily close < $0.42
📊 Thesis
• Superchain mainnet ties OP, Base, Mode & Fraxtal together Q4-25
• Bedrock upgra
Related pairs
OP Roadmap (3D)The OP token has entered a bearish phase after completing a triangle pattern. We are currently in this bearish phase.
Such large bearish phases typically require a sweep of liquidity from key levels before ending. It appears that OP, after sweeping the liquidity below support levels, may reverse an

OP/USDT Weekly Reversal Zone: Strong Bounce ExpectedThe OP/USDT pair is currently showing strong signs of a potential trend reversal from a major long-term demand zone.
📊 Timeframe: 1W (Weekly)
🟨 Key Support Zone: 0.396 – 0.542 USDT
The price has revisited a historically strong support area that previously served as an accumulation zone since mid-20


#OP/USDT#OP
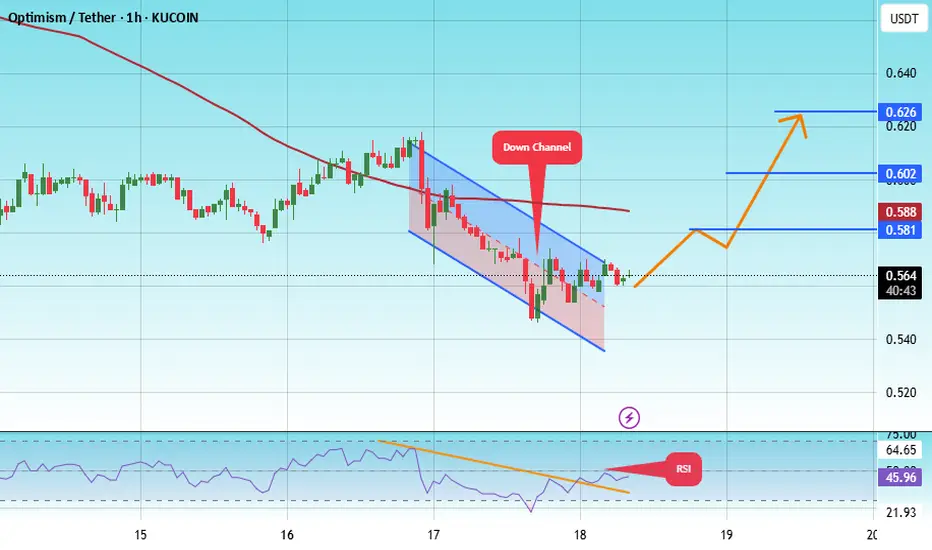
The price is moving within a descending channel on the 1-hour frame, adhering well to it, and is heading toward a strong breakout and retest.
We are experiencing a rebound from the lower boundary of the descending channel. This support is at 0.544.
We have a downtrend on the RSI indicator that
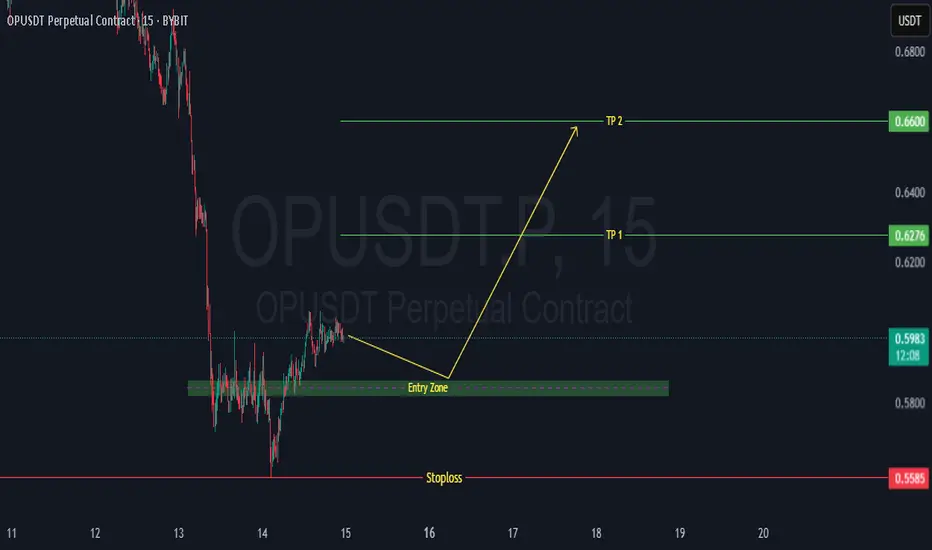
OP BullishA potential long entry could be around the current price range of 0.5864 to 0.5814 USDT, as the price seems to be bouncing off a recent support level near 0.5585. Before entering, it's important to confirm the move with a bullish candlestick pattern like a hammer or engulfing candle, check for a bul
OP / USDT 4hr PUMP INCOMING? OP/USDT – 4H Chart Summary
Market Structure:
4H Timeframe:
- Price consolidating within a descending triangle/wedge pattern, indicating potential buildup before a breakout.
- Lower Timeframes (1H and below): Bearish trend structure with lower highs and lows.
- OBV (On-Balance Volume): Forming

Everyone saw the drop. I saw the gapPrice nuked — but it didn’t break structure. It filled imbalance, paused, and now it's reloading beneath a stack of untouched FVGs. This isn't capitulation. It's orchestration.
The setup:
We’ve got layered 60-minute FVGs stacked from 0.61 to 0.66. That’s the destination — not the mystery. What matt


$OP Building a Strong Base! Breakout Loading?NASDAQ:OP is showing a strong base here around the $0.59–$0.62 zone, holding support perfectly!
A clear breakout above this falling trendline could open the door for a big move → $0.82, $1.08, and even higher toward $1.38+ if momentum builds. 🚀
Structure looks solid, bulls are stepping in again.

See all ideas
Summarizing what the indicators are suggesting.
Oscillators
Neutral
SellBuy
Strong sellStrong buy
Strong sellSellNeutralBuyStrong buy
Oscillators
Neutral
SellBuy
Strong sellStrong buy
Strong sellSellNeutralBuyStrong buy
Summary
Neutral
SellBuy
Strong sellStrong buy
Strong sellSellNeutralBuyStrong buy
Summary
Neutral
SellBuy
Strong sellStrong buy
Strong sellSellNeutralBuyStrong buy
Summary
Neutral
SellBuy
Strong sellStrong buy
Strong sellSellNeutralBuyStrong buy
Moving Averages
Neutral
SellBuy
Strong sellStrong buy
Strong sellSellNeutralBuyStrong buy
Moving Averages
Neutral
SellBuy
Strong sellStrong buy
Strong sellSellNeutralBuyStrong buy
Displays a symbol's price movements over previous years to identify recurring trends.
Frequently Asked Questions
The current price of OP / TetherUS (OP) is 0.528 USDT — it has risen 1.67% in the past 24 hours. Try placing this info into the context by checking out what coins are also gaining and losing at the moment and seeing OP price chart.
OP / TetherUS price has fallen by −2.66% over the last week, its month performance shows a −27.86% decrease, and as for the last year, OP / TetherUS has decreased by −70.45%. See more dynamics on OP price chart.
Keep track of coins' changes with our Crypto Coins Heatmap.
Keep track of coins' changes with our Crypto Coins Heatmap.
OP / TetherUS (OP) reached its highest price on Mar 6, 2024 — it amounted to 4.865 USDT. Find more insights on the OP price chart.
See the list of crypto gainers and choose what best fits your strategy.
See the list of crypto gainers and choose what best fits your strategy.
OP / TetherUS (OP) reached the lowest price of 0.396 USDT on Jun 18, 2022. View more OP / TetherUS dynamics on the price chart.
See the list of crypto losers to find unexpected opportunities.
See the list of crypto losers to find unexpected opportunities.
The safest choice when buying OP is to go to a well-known crypto exchange. Some of the popular names are Binance, Coinbase, Kraken. But you'll have to find a reliable broker and create an account first. You can trade OP right from TradingView charts — just choose a broker and connect to your account.
Crypto markets are famous for their volatility, so one should study all the available stats before adding crypto assets to their portfolio. Very often it's technical analysis that comes in handy. We prepared technical ratings for OP / TetherUS (OP): today its technical analysis shows the sell signal, and according to the 1 week rating OP shows the sell signal. And you'd better dig deeper and study 1 month rating too — it's sell. Find inspiration in OP / TetherUS trading ideas and keep track of what's moving crypto markets with our crypto news feed.
OP / TetherUS (OP) is just as reliable as any other crypto asset — this corner of the world market is highly volatile. Today, for instance, OP / TetherUS is estimated as 1.72% volatile. The only thing it means is that you must prepare and examine all available information before making a decision. And if you're not sure about OP / TetherUS, you can find more inspiration in our curated watchlists.
You can discuss OP / TetherUS (OP) with other users in our public chats, Minds or in the comments to Ideas.