The 2025 Bull Market: Do Not Sell Unless You See A New All-Time How long have you been in this market? You are about to embark on a journey; you are about to experience/enjoy the most sought after phase of the cryptocurrency market, the bull market.
If you've been around for less than four years, you've seen nothing like it. It will blow your mind.
You can see the numbers on the charts, past action and there you have your proof, but nothing can prepare you for the actual experience. Even if you've experienced previous bull markets, the actual event is mind-blowing. We are dying for you to try it. We cannot wait anymore... We just want you to earn, make money, share, have fun and enjoy. We, the Cryptocurrency family, deeply love you and wish for you amazing results.
Don't be shy. Do not be afraid. Buy everything up like it is the end of the world. Once bought, hold. Do not sell. I repeat, do not sell until prices are high, really high up. For example, looking at Optimism, OPUSDT, wait for a new all-time high before taking profits.
Thanks a lot for your continued support.
Leave a comment if you enjoyed the article, it will only take ten seconds.
Namaste.
OPUSDT trade ideas

OP / USDT 4hr PUMP INCOMING? OP/USDT – 4H Chart Summary
Market Structure:
4H Timeframe:
- Price consolidating within a descending triangle/wedge pattern, indicating potential buildup before a breakout.
- Lower Timeframes (1H and below): Bearish trend structure with lower highs and lows.
- OBV (On-Balance Volume): Forming a wedge—suggesting accumulation or distribution phase nearing a breakout.
Key Zones:
Demand Zone (Support):
- 0.5483 – 0.6351
This area has provided strong support historically. A clean break below could signal continuation of the larger downtrend.
Supply Zone (Resistance):
- 0.9068 – 1.0414
-Historically rejected price; high probability of reversal or consolidation if revisited.
Fair Value Gaps (FVG):
- FVG 1: 0.6659 – 0.6838
- FVG 2: 0.7024 – 0.7308
These inefficiency zones are likely to attract price if bullish momentum builds. Watch for potential short-term rejection or continuation setups here.
Volume Profile:
Strongest volume node (high liquidity zone) sits between 0.7470 – 0.8000
Suggests this area has been heavily traded and may act as magnet/resistance if approached again.
Fibonacci Confluence:
Previous swing high at 0.8232 aligns with the 0.618–0.65 golden pocket
A critical zone for potential take-profit or trend reversal on a breakout.
Scenarios:
Bullish Case:
If price holds above 0.6351 and bounces, look for:
- Retest of FVG 1, followed by FVG 2.
- Breakthrough of 0.7308 could target the golden pocket and swing high at 0.8232.
- Sustained bullish move may reach the supply zone above 0.9068.
Bearish Case:
- Breakdown below 0.6351 and especially below 0.5483 would:
- Invalidate the wedge support.
- Confirm continuation of the macro downtrend.
-Open room for new lows and bearish expansion.
Conclusion:
Price is at a key decision point inside a wedge.
Reaction at 0.6351 is critical—support bounce targets higher inefficiencies; breakdown signals deeper bearish continuation.
OBV and volume structure suggest an imminent volatility spike—prepare for a breakout.

OP buy longOPUSDT is bullish from here on daily timeframe. 1D Bullish order block filled and green bullish candles with positive structure are buy sign, So its worth of taking it.

OP !!! Every action has a reaction.A rebound from the sell target levels below the red box must initiate a correction trend for the previous decline toward the WCL areas.
At the 1.63/2.40 price levels, an image of the bearish sequencing will be included below.

Don't miss today's signal.Hello friends
Based on the extensive and comprehensive analysis we conducted, we were able to obtain the buying points and targets for this currency for you so that you can buy in stages with risk and capital management.
*Trade safely with us*

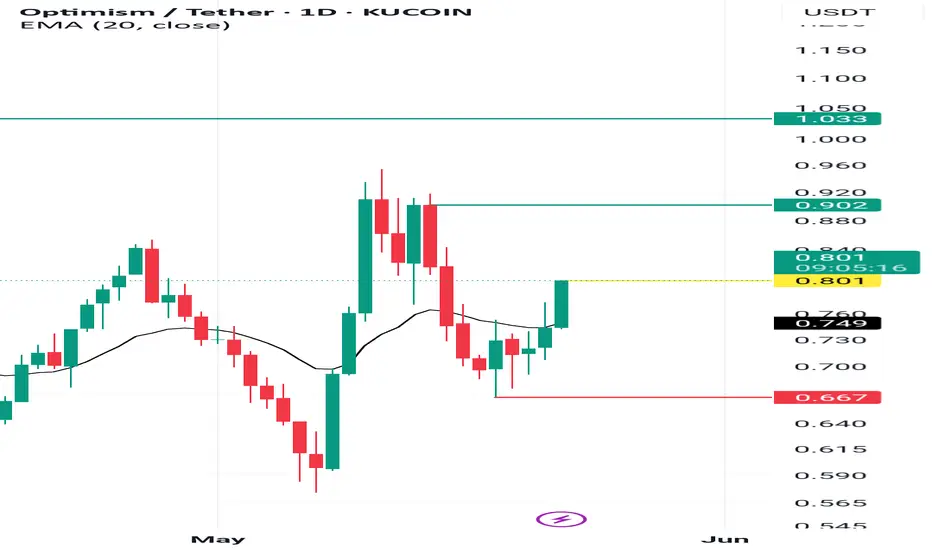
OPUSDT 1D#OP — Reversal in Play? 🚀
#OP is trading inside a Descending Broadening Wedge on the daily chart and has bounced strongly off the support.
A breakout above the wedge resistance could trigger a bullish rally. Potential upside targets:
🎯 $0.795
🎯 $0.921
🎯 $1.023
🎯 $1.124
🎯 $1.269
🎯 $1.454
⚠️ Always use a tight stop-loss to manage risk and protect your capital.

OP - Ranges overview Let's have a quick look at OP.
Market is pretty clean and setting up for some interesting moves in the coming weeks.
Let's see how the market wants to move from here.
IF we reclaim 0.70$ expect us aggressively trade back towards the HTF buyside liquidity at 1.70$.
IF we fail to hold 0.60$ expect us to trade lower towards 0.50$ and eventually 0.40$.
From a HTF perspective we are back into a weekly FVG from October 2022....if you pay attention you will notice it is the exact FVG which 'changed the bearish trend into a bullish trend' - to explain it in simple terms.
WAIT FOR THE MARKET TO SHOW YOU ITS HAND AND TRADE WITH IT.
Stay safe and never risk more than 1-5% of your capital per trade. The following analysis is merely a price action based analysis and does not constitute financial advice in any form.

OPUSDT 1W AnalysisOP ~ 1W Analysis
#OP Buy back gradually from here, this is the lowest support block for now with a short term target of at least 20%+ from here.

OPUSDT 1D AnalysisOP ~ 1D Analysis
#OP Buy in stages from here with a short term target of at least 15%+ and a long term target of $2.7

$OP Building a Strong Base! Breakout Loading?NASDAQ:OP is showing a strong base here around the $0.59–$0.62 zone, holding support perfectly!
A clear breakout above this falling trendline could open the door for a big move → $0.82, $1.08, and even higher toward $1.38+ if momentum builds. 🚀
Structure looks solid, bulls are stepping in again.
Now just need to watch for breakout confirmation.
Stay ready, the next big move may be coming! 👀
DYOR, NFA

#OP/USDT#OP
The price is moving within a descending channel on the 1-hour frame and is expected to break and continue upward.
We have a trend to stabilize above the 100 moving average once again.
We have a downtrend on the RSI indicator that supports the upward move with a breakout.
We have a support area at the lower limit of the channel at 0.600, acting as strong support from which the price can rebound.
Entry price: 0.616
First target: 0.630
Second target: 0.641
Third target: 0.658


#OP/USDT#OP
The price is moving within a descending channel on the 1-hour frame, adhering well to it, and is heading for a strong breakout and retest.
We are seeing a bounce from the lower boundary of the descending channel, which is support at 0.653.
We have a downtrend on the RSI indicator that is about to be broken and retested, supporting the upward trend.
We are looking for stability above the 100 moving average.
Entry price: 0.702
First target: 0.757
Second target: 0.805
Third target: 0.865

#OP/USDT#OP
The price is moving within a descending channel on the 1-hour frame and is expected to continue upward.
We have a trend to stabilize above the 100 moving average once again.
We have a downtrend on the RSI indicator, which supports the upward move by breaking it upward.
We have a support area at the lower limit of the channel at 0.817.
Entry price: 0.860
First target: 0.891
Second target: 0.916
Third target: 0.950

OP/USDT Breakout Alert!!🚀 OP Breakout Alert – 100% Potential Incoming?! 👀🔥
Hey Traders! If you're all about high-conviction plays and real alpha, smash that 👍 and tap Follow for more setups that actually deliver! 💹💯
OP has successfully broken out from the falling wedge pattern on the daily timeframe, which historically signals a strong trend reversal. After retesting the breakout zone, price action looks ready for a fresh upside move!
🔹 Entry: CMP and add more up to $0.76
🎯 Targets:
→ $0.98
→ $1.21
→ $1.43
→ Final Target: $1.64
🛑 SL: $0.688
⚙️ Leverage: Low leverage (Max 5x)
📊 Structure:
Falling wedge breakout ✅
Retest holding strong ✅
Volume starting to pick up 📈
We’re watching closely—this setup has the potential to mimic the last 114% rally. Let's see how it unfolds! 🚀
💬 What’s your take on OP from here?

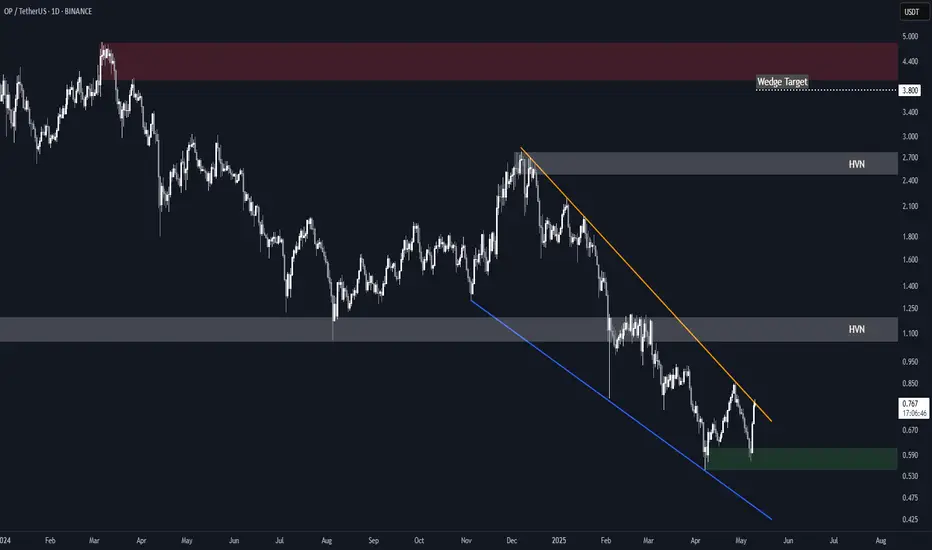
Optimism (OP) Falling WedgeBINANCE:OPUSDT is attempting a breakout from a 14 months long falling wedge.
A sustained break above the resistance in the near term would set the target at $3.80, just shy of the main $4.00-$4.80 supply zone.
Key Levels to Watch
• $0.55-$0.60: Main demand zone and invalidation point for the setup
• $1.00-$1.20: High Volume Node and key S/R dating back to June 2023.*
• $2.50-$2.80: High Volume Node and wedge high point.*
• $4.00-$4.80: Main supply zone.
* These could offer resistance and represent good levels for partial TPs.
#OP time to buy backSuccessfully breakout this resistant line with a short -term target of at least +10% ~ 50%

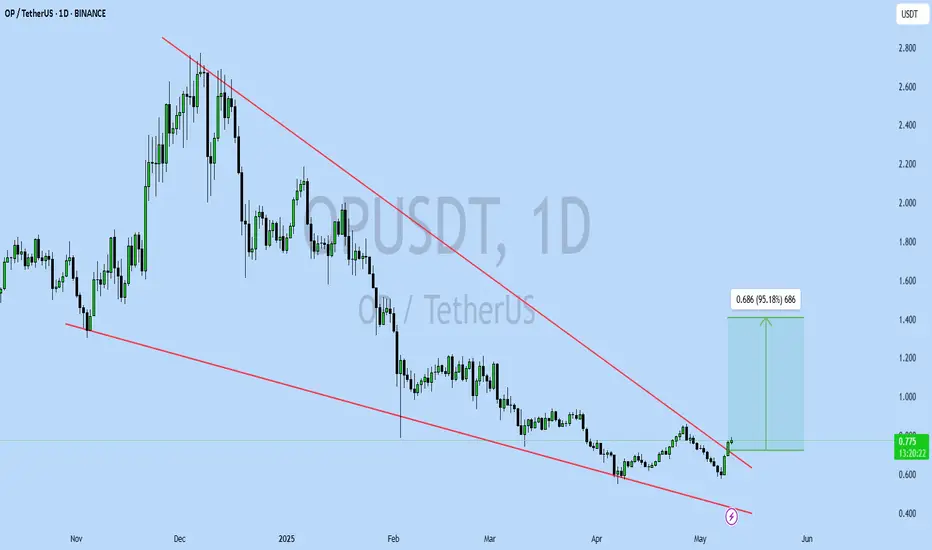
OPUSDT UPDATE
Pattern: Falling Wedge Breakout
Current Price: \$0.776
Target Price: \$1.46
Target % Gain: 95.18%
Technical Analysis: OP has broken out of a long-term falling wedge on the 1D chart, confirming bullish momentum. Breakout is supported by a clear volume spike and strong candle close above resistance.
Time Frame: 1D
Risk Management Tip: Always use proper risk management.
OPUSDT | Long | Liquidity Sweep | (May 7, 2025)OPUSDT | Long | Liquidity Sweep + Bullish Structure | (May 7, 2025)
1️⃣ Short Insight Summary:
After a clean stop-loss hunt, OPUSDT is showing strong signs of accumulation. Liquidity has been swept, and buyers on spot are stepping in aggressively. We're now watching for a bullish follow-through.
2️⃣ Trade Parameters:
Bias: Long
Entry: Current zone after liquidity sweep and W formation confirmation
Stop Loss: 0.49
TP1: 0.915
TP2: 1.197
Final TP: 1.96
Letting it run: Open potential to the upside beyond 2.50 if momentum holds
3️⃣ Key Notes:
✅ Liquidity has been cleared below recent lows, which often signals a reversal.
✅ Open Interest is rising — fresh positions are entering.
✅ Spot CVD is diverging bullishly — showing aggressive buyers stepping in.
✅ Three W formations suggest solid bottoming structure forming.
❌ If price loses 0.49 again with strong volume, the setup becomes invalid.
4️⃣ Follow-up Note:
I'll continue to monitor OPUSDT and update if we get any major changes in structure or volume.
Please LIKE 👍, FOLLOW ✅, SHARE 🙌 and COMMENT ✍ if you enjoy this idea! Also share your ideas and charts in the comments section below! This is best way to keep it relevant, support us, keep the content here free and allow the idea to reach as many people as possible.
Disclaimer: This is not financial advice. Always conduct your own research. This content may include enhancements made using AI.

OPUSDT 1D AnalysisOP ~ 1D Analysis
#OP Buy after successfully penetrating this resistant line with a short -term target of at least 15%+ from here.

OPUSDT Long | Imbalance + Fib Zone ReactionOPUSDT Long | Imbalance + Fib Zone Reaction
BINANCE:OPUSDT Price tapped into the 0.705–0.716 demand zone with strong confluence:
🔹 Imbalance fill
🔹 0.618–0.79 Fib zone
🔹 Consolidation above support
Entry: 0.734
SL: 0.674
TP1: 0.854
TP2: 0.915
Clean structure. Holding as long as 0.674 holds.
#OPUSDT #Altcoins #LongSetup #CryptoTrading #Fibonacci #PriceAction

