ORDI Sell Trade in Bitcoin Retracement"Welcome to my channel! Join me for daily technical analysis of the crypto market's latest trends, from Bitcoin to altcoins. I'll be sharing insights to empower your investment decisions. Stay updated and engage in the comments below! 🚀
Disclaimer: Crypto technical analysis uses historical data to predict future prices. It's not a guarantee and shouldn't be your sole basis for investments. Consider market trends, economic factors, and do your own research. This is not financial advice."
ORDIUSDT trade ideas

ORDIusdt - SHORTThis coin has seen huge potential.
and it ranges below its top. which presents a very good short-trade opportunity.
RSI is oversold and the price is too far away from the slow-moving average line.
use small leverage (2X - 5X) to enter now around 73 - 75 $ mark
Targets:
55$
27$
it can be an excellent trade while BTC is also looking to go down to its fix=b support around 37k.
let the stars align in our favour.
See you on the other side.
** not financial advice. It's just a trade idea.

I am half of! ORDII decided to close half of my short here for ORDI, profits are good and i think BTC could make a pump soon, so i think ORDI could bounce up. I keep 50% of my short in case the support level at 61 USD will not hold, in that case we should see the price to reach 57 first and 47 next

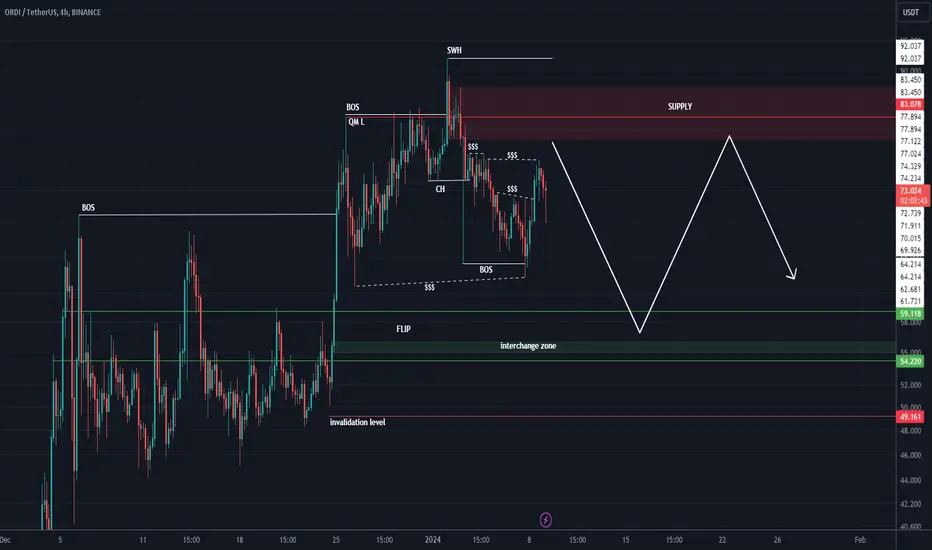
ORDI ANALYSIS (4H)Considering the bearish CH and lower H and L, it seems that ORDI intends to create a RANGE range.
SELL/SHORT positions can be found in the red range and BUY/LONG positions can be found in the green range.
Closing a candlestick below the invalidation level will violate the analysis
For risk management, please don't forget stop loss and capital management
When we reach the first target, save some profit and then change the stop to entry
Comment if you have any questions
Thank You
#ORDI New ATH Soon.#ORDI New ATH Soon. It'll make new record above 92 $.. My SL is 62.20..
ORDI will follow TRB..After ATH massive dump.


ORDI (Y24.P1.E1).Showing weaknessHi Traders,
Looking from a wyckoff reaccumulation perspective, I see it either hold the trend with these Moving averages or not and a sweep below for liquidity makes sense or even deeper to the 618 fib retracement where it has confluence with the 200 Daily Moving Averages.
Regards,
S.SAri

📈 Ordi/usdt Successful Retest? 🚀 Ordi/usdt has confirmed its breakout, and the retest appears to be completed. 🎉 It's time to buckle up as we anticipate a potential price surge of 25-50% in the upcoming days. 📈💰
Remember, this information is for informational purposes only and should not be considered financial advice. Always conduct thorough research before making any investment decisions. Happy trading! 😄💸

ORDI ANALYSIS (4H)The red range consists of qm level and swap, which is a strong range.
We also have two liquidity pools at the top and bottom. According to the bearish CH, it is expected that the high liquidity pool will be swept first and then the price will drop to sweep the low liquidity pool.
Closing a daily candle above the red zone will be analyzed as a violation
For risk management, please don't forget stop loss and capital management
Comment if you have any questions
Thank You

Auction for Bitcoin Ordinals Goes Live on Sotheby’s
Auction house Sotheby’s has opened bidding for its Bitcoin Ordinals collection following the conclusion of its first auction of this same digital collectible last year in December.
Bitcoin Ordinals Auction: Ongoing Curated Sale
The collection auction dubbed “Natively Digital: An Ordinals Curated Sale,” contains 19 pieces of the Bitcoin Ordinals including some rare Satoshis, work from the pioneering artist Shroomtoshi, generative art, and an item connected to the Bitcoin Ordinals brand Taproot Wizards.
The price of the collection ranges from $5000 to about $70,000. Two Shroomtoshi pieces were listed for $50,000-$70,000 and they are the most expensive. One of the Shroomtoshi has reached a $16,000 bid while the other is still on $8,000. FAR for Taproot is listed for $15,000-$20,000, Nullish $30,000-$40,000, and another Nullish Block 9 for $10,000-$15,000.
The “lot” are expected to close independently one minute from each other, however, the auction will close on January 22.
Per a statement from Sotheby’s, “This sale puts a spotlight on the incredible range of creative diversity found within the Bitcoin ecosystem, as Ordinals have seen explosive growth over the past year.”
Sotheby’s first auction for Bitcoin Ordinals was completed on December 13 and it contained three pieces from BitcoinShroom’s collection. This was regarded as one of the first Ordinals projects ever created by Shroomtoshi. The auction of this collection led to an influx of funds. Upon completion, a total of $450,850 was realized from the sales.
Compared to the collective value of the three pieces, the realized funds marked a five times increase.
Bitcoin is Now Duly Competing With Ethereum
With the advent of Bitcoin Ordinals ($ORDI), CRYPTOCAP:BTC is fast competing with Ethereum ( CRYPTOCAP:ETH ) as a digital collectible powerhouse. Moreso, the concept of Ordinals is fast gaining recognition and adoption in the global scene as duly proven by the Sotheby’s listing.
After Gary Gensler, SEC Chair attempted to debunk a false post about Bitcoin ETF approval a few days ago, digital artist Billy moved to immortalize the official’s response to the false Bitcoin ETF approval post as Bitcoin Ordinals.
At the same time, Bitcoin Ordinals have faced some opposition from the likes of Bitcoin ( CRYPTOCAP:BTC ) core developer Luka Dashjr who is pushing for its eradication.

ORDI/USDT.PBYBIT:ORDIUSDT.P
This idea has a medium-term profit target.
All targets are indicated on the graph with a red eye.
- Risk 0.5% on deposit
- R/R 1/2
P.S ( This is not an investment recommendation, this is my personal opinion. )

ORDI - Ordinals going parabolic!ORDI - has accumulated all December long, making new highs, it was not a clear bullish sign, till now.It is breaking for the second time, the second contraction triangle.
starting to get hotter...
i dont see Possibile potential targets (clear zones), as TRB if continues to create highs we need to keep it.If the momentum stays then we continue to buy it.
Good trading

ORDIUSDT - Make or breakORDIUSDT had been in a bullish trend when a bearish divergence on RSI was made, consequently, it went into a correction/ consolidation phase. A H&S pattern has been formed during this phase. Now its in a make or break condition. If it breaks below, bearish side will be confirmed and short positions may be opened, whereas on flip side it top of the pattern is broken, it will move for another high and Stop Buy may be placed

OrdiusdtBulls or bears?
This is important area for Ordi if it breaks the line next purple line is absolutley reachable.
Fibbonacci accept this break but btc is bulish and the situation is risky. I will open my short position after break

ORDI On the way to retraceOrdinals is showing weakness and we can expect a retrace till support zone around 48$. The main support trend line is broken and we could see a retest of it. Stoploss will be place likely above resistance zone around 80$


ORDI/USDT is in a bullish trend.Based on the chart, there are several bullish patterns that could suggest the price of BINANCE:ORDIUSDT is poised for further upside movement. Here are a few indicators:
Ascending Triangle: The price action is forming an ascending triangle, which is a continuation pattern that typically indicates a potential breakout to the upside.
Rising Volume: The volume of trading has been increasing over the past few hours, which often accompanies bullish breakouts.
Price Breaking Above Support: The price has recently broken above a key support level at 48.905 USDT. This level was previously acting as a constraint on the uptrend, and its breakout suggests that the upward movement may have gained momentum. If the price can sustain its gains above this level, it could further bolster the bullish sentiment.
In the event of an upside breakout, the target price ranges are on the chart.
Good Luck


Short OrdiOrdi is showing a strong bearish divergence, failing to break its recent highs. Each attempt to retest these highs is met with strong selling pressure. My SL is set just above these highs and my first TP target is at the 0.618 Fibonacci retracement level. My final TP is aiming for a longer-term trade where I anticipate Ordi to eventually retest its previous resistance level, which could then become a support level in the future. Meanwhile, my strategy is to short Ordi, taking advantage of the bearish momentum and letting the late buyers fill my shorts.
This chart based off of The Elliot Wave Theory, Fibonacci, EMA’s, MacD, RSI, Momentum, and resistance/support zones combined with patterns.


ORDI is going from $70 towards around $550 in January 2024Why?
First off, we are in a bull market that shows no signs of distribution so continuation is more likely.
Secondly, we are in a clear Eliott Wave fifth pattern with waves 1, 2, 3, 4 already done and wave 5 should ensue of a higher mangnitude than wave 3.
Wave 4 was a clear Eliott Wave double three pattern with w, x and triangle in y. Triangle means correction is already done and impulsive wave will follow.

ORDI Bullish Uptrend ConfirmedHappy New Year!
ORDI continues to present bullish uptrend signals. It's possible that we will hit the $100 target very soon.
Once BTC ETF approval is officially confirmed and BTC halving sentiment starts to be priced in, we will be targeting the $500 milestone.
Let's continue building. BRC-20 is here to stay.
