Short opportunity in ORDI/USDTIf break the level 40.000 with a 15 Min red candle there is an opportunity for short. And You need to wait to retest the same level.
Disclaimer : I'm not recommending to take this entry. Do with your analysis too.
Reasons : -
. Trendline breakout.
. A major support level breakout.
After Breakout :-
Entry : 40.000
TP : 38.678
SL : 40.842
ORDIUSDT trade ideas

ORDI potential ORDI / USDT
This coin is belonging to BTC ecosystem !
In last BTC surge just before the 7 months sideway this coin was pumping hard along with BTC and other BRC20 coins
Its possible that when BTC start flying hard above 100k this coins to pump hard again if that scenario happens
Best of wishes

Alikze »» ORDI | Ascending channel - 1D🔍 Technical analysis: Ascending channel - 1D
BINANCE:ORDIUSDT In the daily time frame, it is moving in an ascending channel, which has faced selling pressure in the supply area after hitting the ceiling of the channel.
- In the analysis presented in the previous post , the alternative path was realized, which was corrected up to the $29 range and met with demand again by creating a Double Bottom.
💎Currently, due to the momentum and bullish guard, it can meet the demand again with a zigzag correction in the green box range and break the first supply area towards the specified targets.
💎Therefore, the reversal can be a broken pullback to the swing.
⚠️ In addition, if the correction is sharp and sharp, there will be a possibility of breaking the zone, so if the Invalidation LVL zone is touched, the bullish scenario will be invalidated and should be checked and updated again. ⚠️
»»»«««»»»«««»»»«««
Please support this idea with a LIKE and COMMENT if you find it useful and Click "Follow" on our profile if you'd like these trade ideas delivered straight to your email in the future.
Thanks for your continued support.
Best Regards,❤️
Alikze.
»»»«««»»»«««»»»«««

ORDI Long Reason:
Broken out of Trend.
Strong Bullish Momentum
Liquidity Sweep already taken.
All Price actions suggesting a bullish wave.

ORDIUSDT/ price action analysis(long setup)You're looking at the ORDIUSDT chart. The price has broken out of its downward trend line and established a support zone, marked by the red dashed line. This area might act as a launchpad for the price to climb higher. There's potential for the price to reach the upper black dashed line, which indicates a supply zone around $50-$52. At the moment, the price is moving within the orange ascending channel, with the first target being the channel's upper boundary.
Please keep in mind that this analysis is for informational purposes only. We genuinely welcome any feedback—positive or critical—from traders. The shared text and chart represent personal insights from a financial market enthusiast and are not intended as a basis for trading decisions. I genuinely appreciate any feedback that can help refine my analyses.
Please keep in mind that these observations are purely analytical. Your constructive feedback, whether positive or negative, is always welcome. This chart reflects the perspectives of students and crypto market enthusiasts.
special thanks to all crypto lovers

ORDI: XXX
💡 BINANCE:ORDIUSDT is a tool for creating tokens and digital assets on the Bitcoin network, expanding the functionality of CRYPTO:BTCUSD and providing new opportunities for its use in various crypto projects.
🦬 Advantages:
Limited supply: like Bitcoin, the ORDI token has a maximum supply of 21 million units. This supply is strictly limited, which is similar to the principle of Bitcoin's deflationary economy.
Clear wave structure: I don’t know for sure whether ORDI is in a big bullish cycle, but we will most likely still see at least one wave of surge. Even if we end up with a zigzag structure. The asset is highly likely to receive distribution in the current bull market 🔗link
In a conservative scenario, the token can give 2-3 x, and with positive market conditions, ORDI can surprise and give 6-7 x
🧸 Disadvantages:
I don’t really understand the fundamental value of the project and how the NFT theme can be relevant again. However, thanks to its unique Bitcoin-based token creation mechanism, ORDI can be used to create collectible digital objects similar to NFTs, opening up a new market.
not obvious scalability in the Bitcoin network.
🥤 Let's see what comes of this.
Shaka 🤙
BINANCE:ORDIUSD OKX:ORDIUSDT


SasanSeifi| Will the Price Break Above $38 for Strong Uptrend?Hey there, ✌In the daily timeframe BINANCE:ORDIUSDT , as observed, the price has entered a corrective phase after a significant rise from the $40 range. Following the correction, with the $30 level holding, we have seen positive fluctuations again. Currently, the price is at the $35 range, and during this movement, there have been reactions to the downward trendline.
Since the price is still below the 200-day moving average (EMA 200), paying attention to its behavior near this level and a potential breakout is crucial.
Given the overall market conditions, the medium-term outlook for the price trend appears to be bullish. If the price can maintain the $33 to $31 range and, in the next phase, break above the $38 level along with the EMA 200 and establish itself above it, there is potential for a significant price increase towards the $43 to $45 range.
In this scenario, the market could enter a strong uptrend. Therefore, if the price stabilizes above $38, further upward movement and growth would be likely.
💢 Please remember that this is just my personal viewpoint and should not be taken as investment advice. I’d love to hear your thoughts and share opinions!
Happy trading!✌😎
Sure, if you have any more questions or need further clarification, feel free to ask. I'm here to help!✌

WLD trade entryWeekly timeframe
BINANCE:WLDUSDT witnessed a powerful bullish wave between November 2023 and March 2024. Then a corrective wave (around -70%) followed and formed a multi-month consolidation range. Check out how this range has formed an inverted "Head & Shoulder" pattern just above the overlap level. The flat and narrow bollinger bands hint at a potential explosive move. All ingredient are there for an interesting trade setup.
Strategy
Buy on the break of the resistance line at 43,10$
Objective 1: back to the next resistance at 60$ (+40%)
Objective 2: ATH region at 90$ (+110%)
Objective 3: Trend following strategy
I nvalidation
Mental Stop: below the last low of 39,30$
If prices retrace to this level we will wait for the daily close price then set a Stop loss ¼ or Risk below the weekly close price. This would invalidate the breakout scenario.

Trade Signal Alert: ORDIUSDTDear Traders,
We have identified a promising opportunity to buy ORDIUSDT based on the latest analysis using the EASY Quantum Ai strategy. Here are the specifics of the trade setup:
Direction: Buy
Enter Price: 35.52
Take Profit: 36.73666667
Stop Loss: 33.93666667
This recommendation is guided by a confluence of favorable market conditions and indicators derived from our EASY Quantum Ai strategy.
- Trend Analysis: The current market sentiment shows a strong bullish momentum. Recent price action and volume analysis suggest an upward trajectory, positioning ORDIUSDT for potential gains.
- Support and Resistance Levels: The identified entry price sits comfortably above a robust support level, reducing downside risk while targeting a strategically set take profit zone that aligns with historical resistance.
- Technical Indicators: Key indicators such as Moving Averages and RSI demonstrate bullish signals, indicating potential for continued uptrend strength.
Make sure to manage your risk by adjusting your position size accordingly and adhering to the stop loss level. Stay tuned for further updates and adjust your strategy as market conditions evolve.
Happy Trading!

RODI weekly chart level wave count, the bull is already on the bThe RODI blue second wave ABC3 wave correction alleviated the imbalance and was respected at the discount area order block W+OB20.699. The main rising wave blue third wave is already rising steadily. This is your opportunity to achieve financial freedom.


#ORDI $ORDI potential upmoveWe got a nice long wick rejection from 4hr 21EMA with price action pointing to go up.
Likewise a long entry can be opened.
Entry: 35.15
TP: 37.267
SL: 34.199

#ORDI $ORDI time for some greenery It got nice liquidity below and is ready for some upmove.
Entry: 31.715
TP: 33.644
SL: 30.198

Ordinals: $23, $8 Or $10? Critical Support ActivatedNo predictions here, let's just consider the next support level which is a critical one. ORDIUSDT (Ordinals) is pointing down based on the action happening since early March and recently. The next major support which was already challenged in August is $23. This level is about to be tested again, it was breached briefly on a wick.
If this level breaks, and we have a lower high and the last bounce was small, then ORDIUSDT is set to move to a price of around $10 or $8, that's how far down it can go if support doesn't hold.
Will it break?
It is likely. Trading pairs tend to produce a reversal bottom pattern and consolidation between each bullish phase. ORDIUSDT grew more than 3,280% recently so I wouldn't be surprise if it undergoes a full correction. This is needed and it would be healthy for 2025.
Normally we want to see sustained long-term growth and for this to happen the market has to balance the bullish wave with a correction, this is what you see on the chart.
Of course, we wait and see, everything will be clear in matter of days.
This is a bearish chart. It is pointing down. Lower prices next.
Thank you for reading.
Namaste.

PEOPLE sell/short setupFrom where we put the red arrow on the chart, it looks like PEOPLE's correction has started.
It looks like we have an ABC that we are now at the end of wave B. Wave B is a triangle.
By maintaining the red range, it can drop towards the green range.
Closing a daily candle below the invalidation level will violate this analysis
For risk management, please don't forget stop loss and capital management
Comment if you have any questions
Thank You

#ORDI (SPOT) entry range (22.00- 30.20) T.(70.27) SL (20.72)BINANCE:ORDIUSDT
Keep the order in entry range & waiting for the price to come to fill your order
entry range (22.00 -30.20 )
Target1 (40.50)- Target2 (58.5) - Target3 (70.27)
SL .1D close below (20.72)
*** Collect slowly in the entry range ****
*** This trade is short time investment ****
**** #Manta ,#OMNI, #DYM, #AI, #IO, #XAI , #ACE #NFP #RAD #WLD #ORDI #BLUR #SUI #Voxel #AEVO #VITE #APE #RDNT #FLUX #NMR #VANRY #TRB #HBAR #DGB #XEC #ERN #ALT #IO #ACA ****

ORDIUSDT. 1D TF. Clearly Broke the Downtrend Line. ORDIUSDT preparing for the upward move. Liquidity above 38-40.

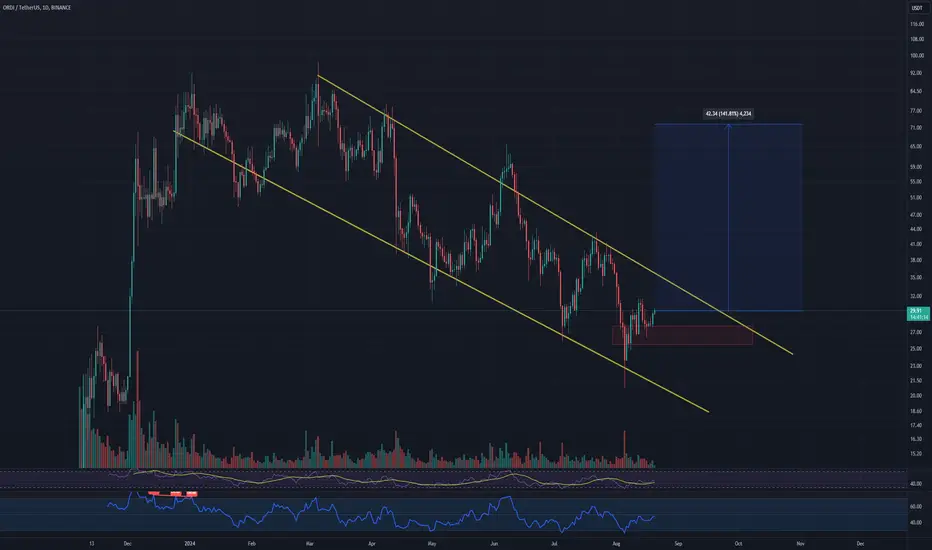
#ORDI Eyeing a 141% Gain! #ORDIUSDT is poised for a significant move! Currently trading at $29.93, the chart indicates a potential breakout with a target of $42.34, representing a possible 141.81% gain. This could be the perfect time to ride the wave! SEED_DONKEYDAN_MARKET_CAP:ORDI
ORDIUSDT: Major Breakout or Breakdown Imminent – Are You Ready?Yello, Paradisers! Have you been watching ORDIUSDT closely? Well, it's showing signs that could lead to a big move! Let's break it down.
💎ORDIUSDT is currently testing a key descending channel and has flashed a Change of Character (CHoCH) towards a bullish market structure. Not only that, but the chart has formed an Inverse Head and Shoulders pattern, which further boosts the chances of a bullish breakout.
💎If ORDIUSDT manages to break above the resistance zone and close a candle above it, this will confirm the Inverse Head and Shoulders pattern, significantly increasing the likelihood of a bullish reversal.
💎On the other hand, if there's a pullback, we could see a bounce from the support zone. However, to confirm this bounce and give ourselves the edge, we’ll need an Internal Change of Character (I-CHoCH) on the lower timeframes.
💎But be cautious. If the price breaks down and closes a candle below the support zone, it would invalidate our entire bullish setup. In that case, it’s wiser to step back and wait for a better opportunity to present itself.
🎖Patience is key here, Paradisers. Remember, only the disciplined and strategic traders make it far. Stick to the plan, and don’t let emotions drive your trades. Stay focused!
MyCryptoParadise
iFeel the success🌴

ORDIUSDT 4H - Bullish breakout zoneORDIUSDT 4H - Bullish breakout zone
If you like my AT, and you agree with the approaches, please FOLLOW ME and press BOOST so we can share it with more people. We are working on an automated trading tool so that everyone can apply their strategies in a VISUAL and PROFESSIONAL way, as we present in the analysis.
Thank you!
_______________________________________________________
ORDIUSDT 4H - Bullish breakout zone
ORDI is about to break its resistance. We only have to set a Stop Loss below the dynamic support in case it turns around.
If it breaks the dynamic support, it could look for the base at $21 again to make a double bottom.
_______________________________________________________
Automated Cryptocurrency Trading Bots: All these strategic alternatives can be configured with TradeX BoT, since it will allow you to position in both directions without having to block any amount per position. It will only be necessary for the conditions to be met, either downward or upward, for the orders to be executed in one direction or another, taking the necessary deposits from your portfolio.
TradeX BoT (in development): Tool to automate trading strategies designed in TradingView. It works with both indicators and technical drawing tools: parallel channels, trend lines, supports, resistances... It allows you to easily establish SL (%), TP (%), SL Trailing... multiple strategies in different values, simultaneous BUY-SELL orders, conditional orders.
This tool is in the process of development and the BETA will soon be ready for testing.
FOLLOW ME and I will keep you informed of the progress we make.
I share with you my technical analysis assessments on certain stocks that I follow as part of the strategies I design for my portfolio, but I do not recommend anyone to operate based on these indicators. Inform yourself, train yourself and build your own strategies when investing. I only hope that my comments help you on your own path :)

ORDI USDT- CLICK HERE TO CHECK NEW ANALYSISIf price rejects from the resistance level, Then we can watch the below demand zone
