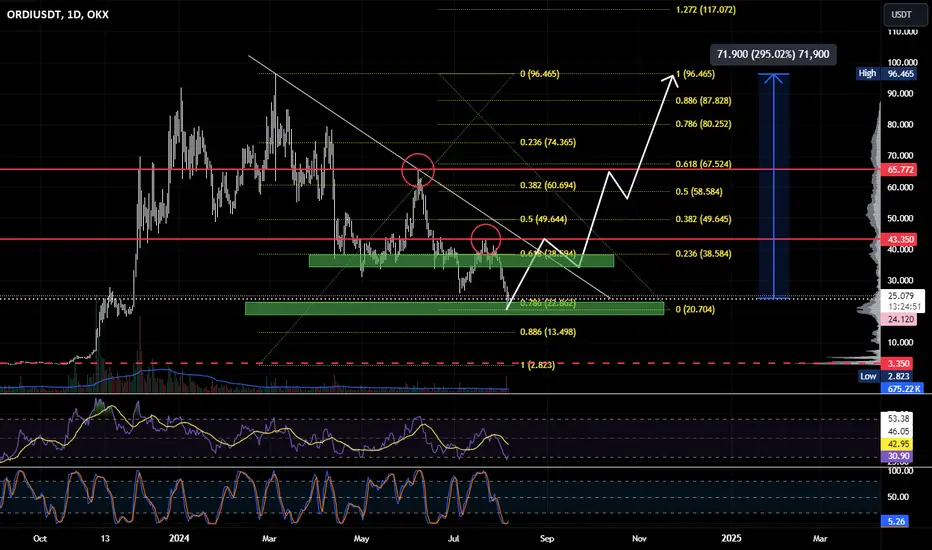
Ordinals | Accumulation Zone Briefly Activated (How To Trade)If just by a tiny bit, the "accumulation zone" for Ordinals has been activated. This is the yellow pattern drawn on the chart.
Ordinals is great but we are now looking at technical analysis and not fundamentals.
The drop on the 5th of August marks a major milestone. While not the end of the corrective move, it does signal that change is soon taking place. Volume was low on the drop; the correction is reaching its end.
We can say the correction ended but within the accumulation phase there can be swings and even lower lows. This is likely what is coming next.
There can be small swings to the upside as well but nothing major until next year, because this is one of the big pairs.
So, to be safe, wait for lower prices... Once lower prices are in, Nov.-Dec., we can consider jumping in. Like this, we secure lower long-term risk.
Lower prices can translate into higher, long-term potential profits.
Patience is key.
Ordinal is not ready yet, but in 2025, definitely a sure win.
Namaste.
ORDIUSDT trade ideas

Breakout SignalsDYOR
this will actually check BB for breakouts and help you execute sells and buys in between based on the support and resistance bands.
do your own research; this is not a financial advice and actual losses might occur


ORDIUSDTmy entry on this trade idea is taken from a point of interest BELOW an inducement.. I extended my stoploss area to cover for the whole swing as price can target the liquidity there before going as i anticipate.. just a trade idea, not financial advise

ORDINALS (Y24.P2.Video1).Potential massive opportunityHi Traders.
This one is worth keeping an eye on and if it plays out to what I described, with conditions , we might find a x10 or more gem.
All the best,
S.SAri

ORDI analysis Going to be starting BINANCE:ORDIUSDT.P with this All-Time Fibonacci
note the v.POC confluence with 0.5 Fib.
Focus on the current weekly candle structure; specifically, will we close above or below the previous sweep level at 25.8 ?
Volume node rotation visualized here:
You may also notice the 1D Sell-Side at 16.3, which may present an opportunity for longs if we lose the current low.
Showing the 1W S.F.P., but as a 30m F.A. with all the key levels to be watched. Starting with the local 0.5 Fib & v.VAL down to the poor lows & All-Time 0.786 Fib.
Also note the DMI at the bottom, D+ (green) crossing over D- (red) is a significant signal for bullish price action when combined with structure. For example: the crossover occurrs during a sweep of the 4H S.S. while creating a good low.
May act like dynamite go boom.
25 Day CC correlation is 0.95, require BTC to flip bullish first.

ORDIUSDT.1DIn my latest technical analysis of the ORDI/USDT daily chart, several critical indicators and price movements offer a nuanced perspective on potential future price action. First and foremost, it's notable that the Moving Average Convergence Divergence (MACD) is displaying a bearish momentum, as indicated by the MACD line residing below the signal line. The separation between these lines suggests that the bearish trend could persist in the short term.
The Relative Strength Index (RSI) is currently at 34.12, nearing the oversold territory but not quite there yet. This suggests that while the selling pressure has been significant, there could be room for more downside before the market considers the asset truly oversold and due for a potential rebound.
Examining the price action, ORDI/USDT has experienced a notable decline, establishing a recent low at $17.57, which I am considering as the current critical support level (S1). Looking forward, if this support holds, it may act as a springboard for a price correction or consolidation phase. The resistance levels to watch are at $44.82 (R2) and initially at $17.57 (R1), which is now a pivotal point for any bullish recovery.
Given the current technical setup, I predict that if the price manages to stabilize and rebound from the S1 level at $17.57, we could see a movement towards R1. This would require a shift in market sentiment and potentially positive developments related to the asset itself. However, should the support at $17.57 fail to hold, it would likely lead to further declines, potentially testing even lower historical supports.
In conclusion, the ORDI/USDT market currently shows bearish tendencies with a close watch on the $17.57 support level. A break below this level could exacerbate the bearish sentiment, while stabilization and a bounce back could pave the way for a retest of higher price levels. Traders should remain cautious and monitor these key technical levels closely, adjusting their strategies based on confirmed price actions and indicator signals.

ORDI buy/long setupThe ORDI symbol has a bearish structure and the price is expected to reach the main demand.
A good demand range is ahead and above the price, in which we look for buy/long positions.
Closing a daily candle below the invalidation level will violate the analysis
Note that the financial market is risky, so:
Do not enter a position without setting a stop and capital management and confirmation and trigger.
When we reach the first TP, save some profit and try to move the stop continuously in the direction of your profit.
If you have any comments please post them, comments will help us improve our performance
Thanks

ORDIUSDT CORRECTION TO THE $30Hello Traders,
I'm currently watching ORDIUSDT and I expect an interesting price movement in the coming days.
Key Levels:
Current Price: $26.88
Support Level: $24
Resistance Level: $30
Analysis:
Price Action: The price has been exhibiting a bearish trend recently, and I anticipate a drop to the $24 support level. This level has shown historical significance as a strong support zone.
Indicators:
RSI: Currently indicating overbought conditions, suggesting a potential for further downside.
MACD: Showing bearish divergence, supporting the case for a correction.
Volume: Decreasing volume on the recent uptrend indicates weakening buying pressure, which aligns with the expected drop.
Candlestick Formation: Watch for the formation of a bullish Luftwing candle around the $24 level. This specific candle pattern typically marks the beginning of significant buy interest, indicating a potential reversal.
Strategy:
Entry Point: Look for potential buy opportunities around the $24 support level, especially if a bullish Luftwing candle forms. This could be an ideal entry point if the price shows signs of reversal.
Target: $30. This is a key resistance level and could be the next target after the anticipated bounce from $24.
Stop Loss: Consider placing a stop loss below $22 to manage risk effectively.
Conclusion:
Keep a close eye on the $24 level for potential buying opportunities. The formation of a bullish Luftwing candle at this level could signal the start of a rally towards $30. As always, manage your risk and trade safely.
Happy Trading!
@thelastluftwaffe

ORDI analysis (12H)From where we placed the red arrow on the chart, it seems that ORDI's correction has started.
This correction appears to be a diametric as we now appear to be in wave e.
From the supply range, it can be rejected downwards.
We are looking for buy/long positions on the green range.
Closing a daily candle below the invalidation level will violate the analysis.
For risk management, please don't forget stop loss and capital management
Comment if you have any questions
Thank You

#ORDI #ORDIUSD #Ordinal correction reached buy zone @78.6% Fibo#ORDI #ORDIUSD #Ordinal correction reached buy zone at 78.6% Fibonacci , personally I take a long position at 24. 1st target at previous high 43.35
$ORDI/USDT pessimistic outlook, I do not invest anymore.I have invested and made good money trading SEED_DONKEYDAN_MARKET_CAP:ORDI for a while. I have ridden the rise and sold at $69, missing the peak and feeling bad at the time.
Now my sentiment about SEED_DONKEYDAN_MARKET_CAP:ORDI is very bearish, and I will explain why I will stop trading it. Here are several events that have happened and are red flags:
1. SEED_DONKEYDAN_MARKET_CAP:ORDI was created in March 2023 by Domo, an enigmatic blockchain analyst; he just posted it on Github, and it was adopted by the team developing Bitcoin code. Binance launched it nobody knows why,
2. SEED_DONKEYDAN_MARKET_CAP:ORDI does not have a proper website. The founder didn't make money out of it and is not supporting it.
3. SEED_DONKEYDAN_MARKET_CAP:ORDI does not have an identified legal entity, no budget, no tokenomics, no roadmap, and no ecosystem.
4. SEED_DONKEYDAN_MARKET_CAP:ORDI now has RUNE (not the Thorchain CRYPTOCAP:RUNE ), which has a questionable name and seems to be a modification of BRC-20 to make money out of it. I personally think that it is shady.
So SEED_DONKEYDAN_MARKET_CAP:ORDI is a VERY HIGH investment risk, manipulated by Binance, with no team, and no future, to be honest. Worse, RUNE seems to be a takeover by Casey Rodarmor, a Bitcoin dev, and the name he has chosen is not compatible with any exchange because it already exists with a top 50 token that is older and succesful!
What the hell is going on?
I think that $95 is the all-time high for this coin for its lifetime, which will dump into oblivion before the end of this bull run, with no fundamental attached to it, I do not see what can save it.
Of course, I might be wrong; some magic could happen, and some pump might occur, but the signs of imminent death are already showing. It has dumped 66%, one of the worst performances of all the top 100 cryptos since its ATH. It is not recovering.
Conclusion: Be very careful with this coin. It has been short-lived and is probably in the process of dying.

ORDI: Looking BearishThe market sentiment for ORDI is currently bearish. Recent technical indicators suggest caution due to potential downside risks.
The MACD is bearish, with the histogram at -0.29 and the MACD line at -1.56, indicating a strong bearish momentum.
With %K at 20.64 and %D at 24.66, the Stochastic Oscillator indicates oversold conditions, suggesting a potential for a short-term rebound.
The RSI is at 30.27, indicating that ORDI is in oversold territory, which could signal a potential reversal or consolidation.
Potential Market Scenarios
Bullish Scenario:
A break above the local resistance at $34.92 could lead to further upward movement, potentially targeting the solid resistance at $39.27. This move would likely confirm bullish momentum and attract more buyers.
Bearish Scenario:
If ORDI fails to break above the local resistance, it could retest the support levels at $31.80 and potentially fall to the dynamic support level at $30.56. A break below $30.56 could signal further declines, with $25.84 acting as the next support level.
Conclusion and Market Outlook
ORDI is currently positioned with significant support and resistance levels to watch. The bearish MACD and overall market activity suggest caution, as the potential for further declines exists. Monitoring the key resistance levels and potential support levels is crucial for making informed trading decisions.

ORDIUSDT Poised for a Major Move Bullish Breakout or Bearish ?Yello Paradisers! Are we on the brink of a bullish breakout, or are we facing a potential bearish breakdown with ORDIUSDT? This cryptocurrency has been navigating a descending channel for a while, and it’s now at a critical juncture.
💎#ORDIUSDT is currently testing a crucial demand zone at $34.30. This level is significant because if the price can sustain above it, we might see a bullish breakout from the descending channel. The upper expansion of the channel also hints at growing bullish sentiment. However, as always, caution is warranted.
💎 If the price fails to hold above $34.30, our focus will shift to the next support level at $25.18. A break below this level could signal a bearish shift, invalidating the current bullish setup and potentially leading to a more substantial decline. This scenario underscores the importance of being prepared for both outcomes.
Remember, disciplined and well-planned trading is the key to consistent success. Stay focused and trade smart, Paradisers!
MyCryptoParadise
iFeel the success🌴

ORDI/USDT Triangle Bullish arrow ( Buy ) The triangle pattern has broken through the resistance line on July 27, indicating a potential bullish price movement. This breakout suggests a shift in market sentiment towards a more positive outlook. Over the next 7 days, we could see the price potentially rise towards 53.0260. This target is derived by measuring the height of the triangle at its widest point and projecting that distance from the breakout point. Traders should watch for confirmation signals and consider this potential trend in their trading strategies.

ORDIUSDTmy entry on this trade idea is taken from a point of interest BELOW an inducement.. I extended my stoploss area to cover for the whole swing as price can target the liquidity there before going as i anticipate.. just a trade idea, not financial advise

ORDI: wait best for candle🟢 Buy Signal for ORDIUSDT 🟢
📍 Entry Point: 38.89 USDT
🎯 Target Prices:
- TP1: 39.50 USDT 🥇
- TP2: 41.90 USDT 🥈
- TP3: 45.73 USDT 🥉
- TP4: 50.35 USDT 🏆
- TP5: 55.65 USDT 🏆
🔴 Stop Loss: 34.76 USDT
📈 Technical Analysis:
After the price hit the support zone and pulled back to the downtrend line, a favorable position for entering a buy trade has been established. Multiple target prices have been set at different levels.
This analysis are based on the provided chart and may need revision with market changes. Always consider risk management and trade only with capital you can afford to lose. 📊💡

ORDI Buy Trade Idea: Leveraging Ordinals' Innovative PotentialDescription
Ordinal (ORDI) offers a unique investment opportunity backed by its strong fundamental qualities. As an innovative cryptocurrency, ORDI aims to enhance the efficiency and security of blockchain transactions through its advanced protocol design. The project emphasizes scalability, aiming to handle a high volume of transactions while maintaining low fees, making it attractive for both users and developers. ORDI's focus on interoperability ensures seamless integration with various blockchain platforms, fostering a versatile ecosystem. With these robust fundamentals, ORDI is well-positioned for significant growth and adoption in the cryptocurrency market.
Disclaimer
Trading and investing in cryptocurrencies involve significant risks and can result in substantial losses. The content provided here is for informational purposes only and should not be considered financial advice. Always conduct your own research, consider your risk tolerance, and consult with a financial advisor before making any investment decisions. Past performance is not indicative of future results, and the value of investments can fluctuate widely.

LONG #ORDIUSDTLONG #ORDIUSDT from $39.095 stop loss $38.871
15m TF. Two clear resistance levels were formed on the coin with a lot of touches, behind which the stops of participants who opened positions from them accumulated. There is also a buyer who pushes the price to update the highs, forming an active preload.
I am considering the formation of consolidation and movement due to stops.
1 TP — 39,473
2 TP — 39,850
3 TP — 40,130

MARKET EYES THE $30 PRICE REGIONSThe ORDIUSDT pair is under close scrutiny as it approaches the $30 mark. Here's a detailed analysis for our crypto community:
🔍 Market Trends:
ORDI has been showing signs of weakness, struggling to maintain recent gains.
The current downward momentum suggests potential further declines.
💡 Key Factors:
Technical Indicators: Moving averages and RSI are signaling a bearish trend, indicating potential selling pressure.
Resistance Levels: The key resistance level stands at $33, which has been a tough barrier to break.
Support Levels: There are no significant support levels nearby, making the market more vulnerable to further drops.
📊 Market Sentiment:
Overall market sentiment is turning bearish, with traders cautious about further declines.
Pay attention to any major news or events that could impact market sentiment and price action.
🔔 Trading Strategy:
For Bears: Consider short positions if the price fails to break the $33 resistance level. Target the $30 region, and monitor for signs of continued weakness.
For Bulls: Exercise caution and wait for a clear reversal signal before entering long positions. Without significant support, the market may continue to drop.
Stay informed with the latest analysis and trade carefully. Happy trading!
#ORDIUSDT #CryptoAnalysis #Trading #MarketUpdate #CryptoNews

ORDIUSDT.PORDIUSDT.P is in bearish trend.
Potentially printing LH and LL.
Bearish divergence also shown in RSI.
We wait and watch for the breakout of last LL.

Alikze »» ORDI | Pullback to the broken area.?🔍 Technical analysis: Pullback to the broken area.?
- It is moving in a downward channel in the daily and 4H time frames.
- In the previous post , price reversal zones were identified, which after hitting PRZ-3, the price reversed and corrected the price up to the set targets.
- At present, according to the downward behavior and structure, the price correction can be continued.
- Therefore, if this price reversal cannot lead to the failure of the region, this reversal can be a pullback to the broken structure.
- So, we expect that the price will face selling pressure in response to the supply, first the price will be corrected to $25 and then the price correction will continue until the green box.
💎 Alternative scenario: if the price can break the supply range and stabilize above it, it can navigate the second movement path and move up to the red box range and the ceiling of the descending channel.
»»»«««»»»«««»»»«««
Please support this idea with a LIKE and COMMENT if you find it useful and Click "Follow" on our profile if you'd like these trade ideas delivered straight to your email in the future.
Thanks for your continued support.
Best Regards,❤️
Alikze.
»»»«««»»»«««»»»«««
BINANCE:ORDIUSDT

ORDI price is preparing powerful impulse, the question is where?The #ORDIUSDT price is in a long consolidation, trading volumes are falling, as is possible interest in it.
The delta of trading shows that sales are slightly higher than buying in the consolidation.
Perhaps this consolidation is a preparation for the continuation of super growth, as it was before with a similar but smaller pattern.
But personally, if we were to decide to buy SEED_DONKEYDAN_MARKET_CAP:ORDI , it would be not earlier than in the range of $25-28.
Or would you say that this is already an unrealistic price?)
Write your thoughts in the comments.
