US30 TRADE IDEAWE were expecting price to react to our key levels 33800 if we hold this level 34200 is possible or else, we can see downfall towards our key level 33580.
DJIA1! trade ideas

dow jones us 30 long setupit seems dow is the strongest today
therefore the value rotaion might be a better play in dow.

Dow, for the ones who do not believe in diagonal lines. Simple horizontal lines.
Simple diagonal lines.
Both work, deal with it.

YM1! US30USD DOW 2023 FEB 06
YM1! US30USD DOW 2023 FEB 06
No trades taken for Dow last week as price stayed away from the
boundary of the rotation zone. We now have a rotation within
a rotation zone 34432-33624 :)
This is about 800pt range.
A modest upward trendline has formed, but but but demand is
is showing effort no result.
The 800pt range, although attractive, will unlikely be easy to trade.
Possible scenarios:
1) Rotational play: Trades can be executed at boundary of rotation
range 34605 / 32789.
- 34605-34432: Consideration - will market trace Nasdaq & SnP
for a breakout?
- Short if rejected at 34605-34432
2) Rotational breakout/breakdown:
- If price breakout, long when price retraces and finds support
Volume Analysis:
Weekly: Ave vol down bar close in middle = indecisive
Daily: Higher vol down bar close of low = some demand
H4: Ultra hi vol level bar, S>D = Supply coming in
Price reaction levels
Short on Test and Reject | Long on Test and Accept
35750 35228 34432-34605
33624 33037- 32789
Remember to like and follow if you find this useful.
Have a profitable week ahead.


Dow Jones: Friday Feels 🍾After moving sideways, the Dow Jones should finally commit to dropping to the orange target zone. Within 32 401 and 31 689 points, the Index should hit the corrective low of the orange wave iv, which would turn the trend back North. On that note, we expect the course to rise above the resistance line at 34 707 in order to complete the blue wave (i). In our alternative scenario with a probability of 45%, the Dow Jones could exceed the resistance mark at 34 707 points right away, without dropping into a correction beforehand.


YMCBOT_MINI:YM1!
has been lagging, needs to catch up
nice vwap bounce seen multiple times.
can see 34548 on the next leg upside
else back to support of
34000,
33700

Dow Futures - Consolidative double three corrective waveThe Dow futures is heading for another upside. Will it be a 3rd wave is too early to tell but all we know is that 1) the correction is yet to be over, likely 33,205 support is the strong rebound region. 2) 36,000 resistance will be a strong resistance.

Feb starting with BEAR in action. See description.Here my vision last night with DOWNJones and operating WING23 (Brazil Futures).
Great Day.

DOW 1 HOUR : UPPER TARGET IS 35300 AND DOWN TARGET IS 31111we have 3 angeel on dow and look like want go to fibo161%(nasdaq too,,have buy ) dont pick sell more ,,,for sell we need dow break RED TREND LINE
buystop on high + buy above green arrow near EMA200 1hour is best action for now
if you have old sells, 100% put hedge buystop on last high and never never close it (main trend is up) , break 3angel will flyup dow ,,,,, then in next low close your sells frist,then in high close hedge buy
ALERT = INDEX LIKE NASDAQ,DOW,DAX ARE VERY COMPLEX,HARD NEED MINIMUM 5 YEAR PRACTICE ON DEMO ,if you dont have 5 year practice dont trade it in real money
good luck

One of my favorites setups
1) 0.5 retracement
2) avwap
3) strong leg in the pullback
4) up slope median line

DOW JONES: Double test on the major Lower Highs. Critical.Dow Jones made a double hit on the Major LH trend line created on the December 13th top. So far it has failed to close above it, which is a bearish sign. Both 1D and 4H are neutral (RSI = 53.203, MACD = 57.710, ADX = 22.013).
Our usual approach with candle closes suggests that one above the Major LH is bullish (TP 34,490 R1) and below the 4H MA50 bearish (TP 33,450).
Previous analysis:
## If you like our free content follow our profile to get more daily ideas. ##
## Comments and likes are greatly appreciated. ##

YM1! US30USD DOW 2023 JAN 29
YM1! US30USD DOW 2023 JAN 29
No trades taken for Dow last week as price stayed away from the
boundary of the rotation zone. Market crawled up on declining
volume, a sign of weakness.
Possible scenarios:
1) Rotational play: Trades can be executed at boundary of rotation
range 34605 / 32789.
- Long if supported at 32789-33037
- Short if rejected at 34605-34432
2) Rotational breakout/breakdown:
- If price breakout, long when price retraces and finds support
- If price breakdown, short when price retraces and is rejected
Volume Analysis:
Weekly: Ave vol up bar close off high = No demand
Daily: Low vol up bar close off high = No demand
H4: Ultra High vol up bar close off high, followed by ave vol
down bar = weakness confirmed
Price reaction levels
Short on Test and Reject | Long on Test and Accept
35750 35228 34432-34605
33037- 32789 30513 28635
Remember to like and follow if you find this useful.
Have a profitable week ahead.

YM1! US30USD DOW 2023 JAN 23
YM1! US30USD DOW 2023 JAN 23
Last week, Dow Scenario1 rejection of 34605 short yielded 900pts
(trail stop TP).
With this rejection, DOW now exhibits rotation behavior
34605 - 32789.
Possible scenarios:
1) Rotational play: Trades can be executed at boundary of rotation
range 34605 / 32789.
- Long if supported at 32789
- Short if rejected at 34605
2) Rotational breakout/breakdown:
- If price breakout, long when price retraces and finds support
- If price breakdown, short when price retraces and is rejected
Volume Analysis:
Weekly: Low vol wide spread S>D bar = weakness
Daily: Ave vol up bar close at high = No demand
H4: High vol up bar closed off high = minor weakness
Price reaction levels
Short on Test and Reject | Long on Test and Accept
35750 35228 34416-34605
32789 30513
28635
Remember to like and follow if you find this useful.
Have a profitable week ahead.

Aspects to Market Making Sentiment IIA period of low spread and low volume can indicate a lack of liquidity in the market. This can be caused by a variety of factors, such as a lack of investor interest in the security or derivative, or a lack of market participants willing to trade at the current bid and ask prices.
In this case, a market maker may choose to adjust its strategy to manage the risk of holding a large position in the security or derivative. One strategy that the market maker may use is hedging, which involves taking offsetting positions in other securities or derivatives to reduce the risk of loss from unexpected market movements.
For example, if the market maker has a large position in a stock and is concerned about a potential price decline, the market maker may use options or short selling to hedge against this risk.
Alternatively, the market maker may choose to hold onto its position and wait for market conditions to improve. This may involve adjusting the bid and ask prices to attract more buyers or sellers, or reducing the size of the position to manage the risk of holding a large position in an illiquid market.
The market maker's decision to hedge or hold the position will depend on the market maker's risk appetite, the specific market conditions, and the market maker's own outlook on the future movements of the security or derivative.
In summary, a period of low spread and low volume can indicate a lack of liquidity in the market, in this case, a market maker may choose to adjust its strategy to manage the risk of holding a large position, one strategy is hedging,
which involves taking offsetting positions in other securities or derivatives to reduce the risk of loss from unexpected market movements. The market maker may also choose to hold onto its position and wait for market conditions to improve,
adjusting the bid and ask prices to attract more buyers or sellers, or reducing the size of the position to manage the risk of holding a large position in an illiquid market. The decision to hedge or hold the position
will depend on the market maker's risk appetite, the specific market conditions, and the market maker's own outlook on the future movements of the security or derivative.

DOW JONES: Oversold. A buy opportunity.Dow Jones turned red on the 1D time frame (RSI = 42.944, MACD = 52.430, ADX = 23.942) but oversold on the 4H (RSI = 24.370, MACD = -196.780, ADX = 55.260), which is the exact conditions we've been eyeing for a buy entry.
The sharp drop that followed the 4H MA50 breach closed on the HL trend line. The pattern is a Rising Megaphone and right now the price sits at the very bottom. With the oversold 4H RSI reversing, this is a similar buying opportunity as the last leg of the previous Rising Megaphone on December 6th/7th. We have denoted S1, a pivot (P1) and R1, which is the target. A +4.30% rise is common on this pattern, it suits ideally the 34,490 target.
## If you like our free content follow our profile to get more daily ideas. ##
## Comments and likes are greatly appreciated. ##
## Also DONATIONS through TradingView coins help our cause of increasing the daily ideas put here for free and reach out more traders like you. ##

Dow Futures (YM) Looking for 5 Waves Elliott Wave Move LowerCycle from 12.13.2022 high in Dow Futures (YM) is unfolding as a zigzag Elliott Wave structure. Down from 12.13.2022 high, wave A ended at 32686. Wave B rally ended at 34487 as the 90 minutes chart below shows. Internal subdivision of wave B unfolded as a zigzag structure in lesser degree. Up from wave A, wave ((a)) ended at 33663 and dips in wave ((b)) ended at 32750. Index then extended higher in wave ((c)) as a 5 waves diagonal. Up from wave ((b)), wave (i) ended at 33613 and dips in wave (ii) ended at 32943. Wave (iii) ended at 34080, wave (iv) ended at 33489, and final leg higher wave (v) ended at 34487 which completed wave ((c)) and B in higher degree.
Wave C lower is currently in progress as an impulse structure. The Index still needs to break below wave A at 32686 to confirm this view. Down from wave B, wave (i) ended at 33916 and rally in wave (ii) ended at 34131. Wave (iii) ended at 33318 and expect rally in wave (iv) to fail and Index to extend lower in wave (v) to complete wave ((i)). Afterwards, it should rally in wave ((ii)) to correct cycle from 1.16.2023 high before the decline resumes. Near term, as far as pivot at 34487 high stays intact, expect rally to fail in 3, 7, or 11 swing for further downside. Potential target lower is 100% – 161.8% Fibonacci extension of wave A. This area comes at 30385 – 31952 from where buyers can appear and Index can start to resume higher.

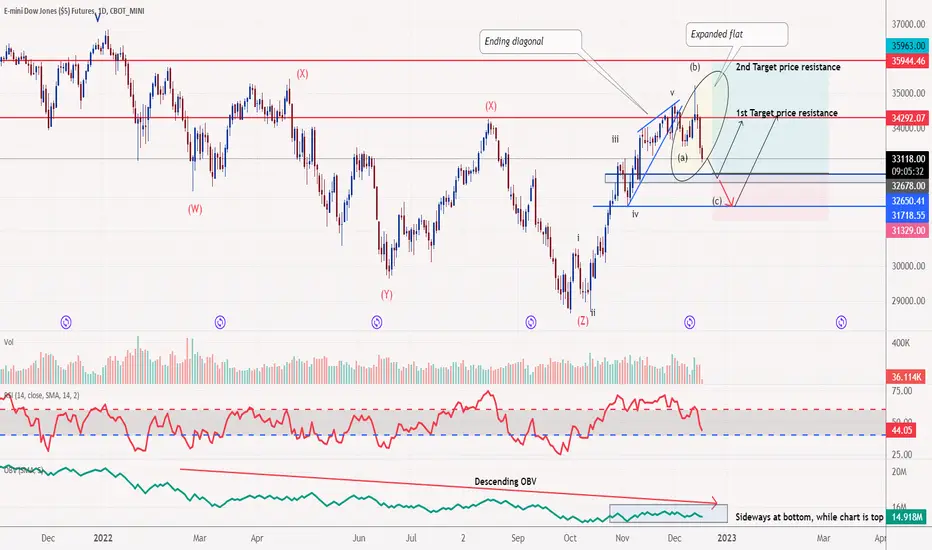
Dow futures - heading for a last leg of sub-wave CThe dow has officially completed its first sub-impulse 5-wave and an expanding flat is ongoing with the last leg C wave heading for the support near 32,500 level. Overall, the rebound may not be strong and should exit quickly upon reaching the first target resistance at 34,292
Weekly levels update (Week 3)Bull traps are back this week. With bulls failed at 34460 and 34105, the Dow is heading down to 33498 until new traps are spotted.

YM1! DJIA 1h bear bat harmonicYM1! entered bearish bat harmonic, and is on it's way to pt1=33701. Expect bullish retracement at that level with retest of recent high, then downward again to pt2=33315 and likely 32686.

DJIA: Will the US stock market crash?#DJIA
#ShaneElliottWave
DJIA 1W Chart analysis
17 Jan, 2023 (UTC+7)
Hello traders and holder,
That's my wave count for: DJIA
Timeframe Analysis: 1W
Expect Main Elliott Mode: Corrective
Expect Main Structure: Zigzag
Now Stucture: Second wave (black- intermediate degree)

YM1! US30USD DOW 2023 JAN 15YM1! US30USD DOW 2023 JAN 15
Dow was ranging mostly for the past 2 weeks. A
As market approaches previous rejection area, keep
stops tight. No demand on all 3 TF, temporary weakness
may be expected. Possibility of short on rejection
if market crawls upward and is rejected at higher
levels.
Possible scenarios:
1) Short on rejection of 35228 / 34605
2) Long if test and accept at previous rotation 33663
Volume Analysis:
Weekly: Low vol up bar close at high = No Demand
Daily: Low vol level bar close toward high = No Demand
H4: Low vol narrow spread up bar close off high
= No demand
Price reaction levels
Short on Test and Reject | Long on Test and Accept
35750 35228 34416-34605
33663 32789 30513
28635
Remember to like and follow if you find this useful.
Have a profitable week ahead.
