DJIA1! trade ideas

US30 H4 Potential Bounce | 13th JuLY 2022On the H4, with price moving above the ichimoku cloud, we have a bullish bias that price will rise from our 1st support at 31218 where the horizontal pullback support is to our 1st resistance at 31866 in line with the horizontal swing high resistance. Alternatively, price may not break 1st support and head for 2nd support at 30434 where the horizontal swing low support is.
Please be advised that the information presented on TradingView is provided to Vantage (‘Vantage Global Limited’, ‘we’) by a third-party provider (‘Everest Fortune Group’). Please be reminded that you are solely responsible for the trading decisions on your account. There is a very high degree of risk involved in trading. Any information and/or content is intended entirely for research, educational and informational purposes only and does not constitute investment or consultation advice or investment strategy. The information is not tailored to the investment needs of any specific person and therefore does not involve a consideration of any of the investment objectives, financial situation or needs of any viewer that may receive it. Kindly also note that past performance is not a reliable indicator of future results. Actual results may differ materially from those anticipated in forward-looking or past performance statements. We assume no liability as to the accuracy or completeness of any of the information and/or content provided herein and the Company cannot be held responsible for any omission, mistake nor for any loss or damage including without limitation to any loss of profit which may arise from reliance on any information supplied by Everest Fortune Group.

Potential Bullish ContinuationOn the H4, with price moving in an ascending trendline on the RSI, we have a bullish bias that price will continue to rise from the pivot at 30821 in line with the pullback support and 61.8% fibonacci retracement to the 1st resistance at 31852 at the swing high in line with the 61.8% fibonacci projection and 50% fibonacci retracement. Alternatively, price may break the support structure at the pivot and drop to the 1st support at 30405 the multiple swing low in line with the 61.8% fibonacci projection
Any opinions, news, research, analyses, prices, other information, or links to third-party sites contained on this website are provided on an "as-is" basis, as general market commentary, and do not constitute investment advice. The market commentary has not been prepared in accordance with legal requirements designed to promote the independence of investment research, and it is therefore not subject to any prohibition on dealing ahead of dissemination. Although this commentary is not produced by an independent source, FXCM takes all sufficient steps to eliminate or prevent any conflicts of interest arising out of the production and dissemination of this communication. The employees of FXCM commit to acting in the clients' best interests and represent their views without misleading, deceiving, or otherwise impairing the clients' ability to make informed investment decisions. For more information about the FXCM's internal organizational and administrative arrangements for the prevention of conflicts, please refer to the Firms' Managing Conflicts Policy. Please ensure that you read and understand our Full Disclaimer and Liability provision concerning the foregoing Information, which can be accessed on the website

US30 Potential Bullish rise | 12th July 2022On the H4, with price moving above the ichimoku cloud, we have a bullish bias that price will rise from our 1st support at 31218 where the horizontal pullback support is to our 1st resistance at 31866 in line with the horizontal swing high resistance. Alternatively, price may not break 1st support and head for 2nd support at 30434 where the horizontal swing low support is.
Any opinions, news, research, analyses, prices, other information, or links to third-party sites contained on this website are provided on an "as-is" basis, as general market commentary, and do not constitute investment advice. The market commentary has not been prepared in accordance with legal requirements designed to promote the independence of investment research, and it is therefore not subject to any prohibition on dealing ahead of dissemination. Although this commentary is not produced by an independent source, FXCM takes all sufficient steps to eliminate or prevent any conflicts of interest arising out of the production and dissemination of this communication. The employees of FXCM commit to acting in the clients' best interests and represent their views without misleading, deceiving, or otherwise impairing the clients' ability to make informed investment decisions. For more information about the FXCM's internal organizational and administrative arrangements for the prevention of conflicts, please refer to the Firms' Managing Conflicts Policy. Please ensure that you read and understand our Full Disclaimer and Liability provision concerning the foregoing Information, which can be accessed on the website.

YM1! - Dow Futures Weekly Analysis, 7/11/22The TEAL descending channel structure was able to support selling pressures last week.
Resistance above, BOTH the BLACK and ORANGE would need to be overtaken for this market to grind higher.
Support and Resistance structures have been adjusted for your reference this upcoming week.
Wishing you a blessed and profitable week!

US30USD YM1! DOW 2022 JULY 11 Week
US30USD YM1! DOW 2022 JULY 11 Week
Last week, rotation support long was good. 3 TF analysis is displaying weakness.
We should be expecting lower prices temporarily.
I'm keeping the existing scenario plan from last week.
Possible scenarios:
1) Channel resistance / rotational resistance = short
2) Market rotation = trade at boundary of range
3) Behavior change senario
4) Trend continuation - channel boundary trades
Price reaction levels
Short on Test and Reject | Long on Test and Accept
32563 31867
30406 29639 26212
Weekly: Low volume up bar close off high = minor weakness
Daily: Ave vol up bar close toward low = weakness
H4: Very high vol up bar close off high toward middle + level close in background
= weakness
Remember to like and follow if you find this useful.
Have a profitable week ahead.

DowJones Targeting The Equality Objective @32500In this update we review the recent price action in the DowJones futures contract and identify the next high probability trading opportunity and price objectives to target

US30 Potential bullish bounce | 08th July 2022On the H4, with price moving above the ichimoku cloud , we have a bullish bias that price will rise from our 1st support at 31218 where the horizontal pullback support is to our 1st resistance at 31866 in line with the horizontal swing high resistance. Alternatively, price may not break 1st support and head for 2nd support at 30434 where the horizontal swing low support is.
Please be advised that the information presented on TradingView is provided to Vantage (‘Vantage Global Limited’, ‘we’) by a third-party provider (‘Everest Fortune Group’). Please be reminded that you are solely responsible for the trading decisions on your account. There is a very high degree of risk involved in trading. Any information and/or content is intended entirely for research, educational and informational purposes only and does not constitute investment or consultation advice or investment strategy. The information is not tailored to the investment needs of any specific person and therefore does not involve a consideration of any of the investment objectives, financial situation or needs of any viewer that may receive it. Kindly also note that past performance is not a reliable indicator of future results. Actual results may differ materially from those anticipated in forward-looking or past performance statements. We assume no liability as to the accuracy or completeness of any of the information and/or content provided herein and the Company cannot be held responsible for any omission, mistake nor for any loss or damage including without limitation to any loss of profit which may arise from reliance on any information supplied by Everest Fortune Group.

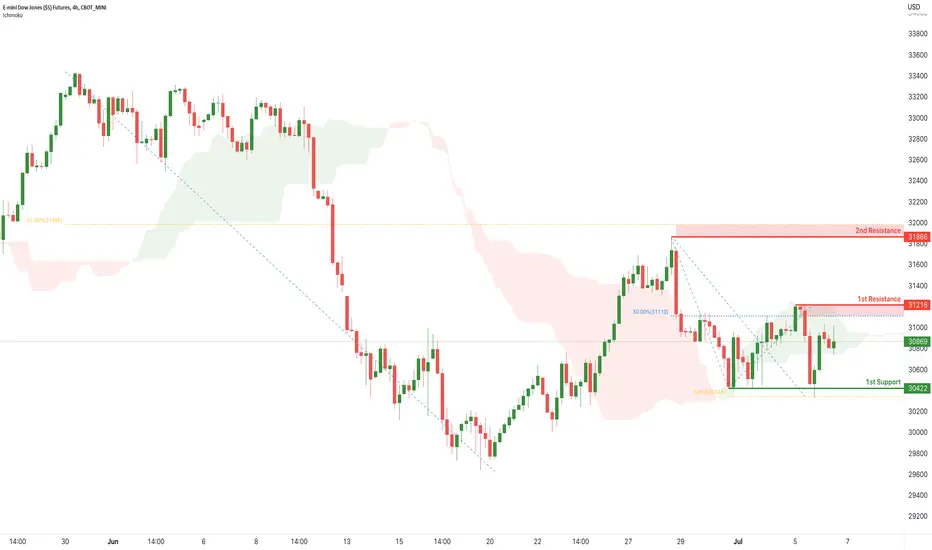
US30 Potential bearish drop | 7th July 2022On the H4, with price expected to reverse off the ichimoku cloud , we have a bearish bias that price will drop to our 1st support at 30422 where the horizontal swing low support and 61.8% Fibonacci retracement are from our 1st resistance at 31216 in line with the horizontal swing high resistance and 50% Fibonacci retracement . Alternatively, price may break 1st resistance and head for 2nd resistance at 31866 where the horizontal swing high resistance and 61.8% Fibonacci retracement is.
Any opinions, news, research, analyses, prices, other information, or links to third-party sites contained on this website are provided on an "as-is" basis, as general market commentary, and do not constitute investment advice. The market commentary has not been prepared in accordance with legal requirements designed to promote the independence of investment research, and it is therefore not subject to any prohibition on dealing ahead of dissemination. Although this commentary is not produced by an independent source, FXCM takes all sufficient steps to eliminate or prevent any conflicts of interest arising out of the production and dissemination of this communication. The employees of FXCM commit to acting in the clients' best interests and represent their views without misleading, deceiving, or otherwise impairing the clients' ability to make informed investment decisions. For more information about the FXCM's internal organizational and administrative arrangements for the prevention of conflicts, please refer to the Firms' Managing Conflicts Policy. Please ensure that you read and understand our Full Disclaimer and Liability provision concerning the foregoing Information, which can be accessed on the website.

US30 Potential bearish drop | 7th July 2022On the H4, with price expected to reverse off the ichimoku cloud, we have a bearish bias that price will drop to our 1st support at 30422 where the horizontal swing low support and 61.8% Fibonacci retracement are from our 1st resistance at 31216 in line with the horizontal swing high resistance and 50% Fibonacci retracement. Alternatively, price may break 1st resistance and head for 2nd resistance at 31866 where the horizontal swing high resistance and 61.8% Fibonacci retracement is.
Any opinions, news, research, analyses, prices, other information, or links to third-party sites contained on this website are provided on an "as-is" basis, as general market commentary, and do not constitute investment advice. The market commentary has not been prepared in accordance with legal requirements designed to promote the independence of investment research, and it is therefore not subject to any prohibition on dealing ahead of dissemination. Although this commentary is not produced by an independent source, FXCM takes all sufficient steps to eliminate or prevent any conflicts of interest arising out of the production and dissemination of this communication. The employees of FXCM commit to acting in the clients' best interests and represent their views without misleading, deceiving, or otherwise impairing the clients' ability to make informed investment decisions. For more information about the FXCM's internal organizational and administrative arrangements for the prevention of conflicts, please refer to the Firms' Managing Conflicts Policy. Please ensure that you read and understand our Full Disclaimer and Liability provision concerning the foregoing Information, which can be accessed on the website.

YM H4wait until the support line breaks
In this update, we review the recent price action in the Dow Jones futures contract and identify the next high-probability trading opportunities and price objectives to target

US30 Potential bearish drop | 06th July 2022On the H4, with price expected to reverse off the ichimoku cloud, we have a bearish bias that price will drop to our 1st support at 30422 where the horizontal swing low support and 61.8% Fibonacci retracement are from our 1st resistance at 31216 in line with the horizontal swing high resistance and 50% Fibonacci retracement. Alternatively, price may break 1st resistance and head for 2nd resistance at 31866 where the horizontal swing high resistance and 61.8% Fibonacci retracement is.
Any opinions, news, research, analyses, prices, other information, or links to third-party sites contained on this website are provided on an "as-is" basis, as general market commentary, and do not constitute investment advice. The market commentary has not been prepared in accordance with legal requirements designed to promote the independence of investment research, and it is therefore not subject to any prohibition on dealing ahead of dissemination. Although this commentary is not produced by an independent source, FXCM takes all sufficient steps to eliminate or prevent any conflicts of interest arising out of the production and dissemination of this communication. The employees of FXCM commit to acting in the clients' best interests and represent their views without misleading, deceiving, or otherwise impairing the clients' ability to make informed investment decisions. For more information about the FXCM's internal organizational and administrative arrangements for the prevention of conflicts, please refer to the Firms' Managing Conflicts Policy. Please ensure that you read and understand our Full Disclaimer and Liability provision concerning the foregoing Information, which can be accessed on the website.
Dow Jones FutureBreakout or Breakdown either side
When the prices are in an uptrend a bullish flag pattern shows a slow consolidation lower after an aggressive uptrend.
This indicates that there is more buying pressure moving the prices up than down and indicates that the momentum will continue in an uptrend.
Traders wait for the price to break above the resistance of the consolidation after this pattern is formed to enter into the market.

YM1! Monthly looking like possible bullish move aheadLooks like 28847 is the line in the sand
If this level holds then a bull rally is likely, otherwise hold on to your stomach it will get bumpy!

US30 Potential bullish bounce | 05th July 2022On the H4, with price moving along an ascending channel and expected to break out of the ichimoku cloud, we have a bullish bias that price will rise from our 1st support at 30862 where the horizontal pullback support and 38.2% Fibonacci retracement are to our 1st resistance at 31866 in line with the horizontal swing high resistance and 61.8% fibonacci retracement. Alternatively, price may break 1st support and head for 2nd support at 30149 where the horizontal swing low support and 78.6% fibonacci retracement are. Take note we are waiting for the break of the 1st resistance to confirm the bullish move.
Any opinions, news, research, analyses, prices, other information, or links to third-party sites contained on this website are provided on an "as-is" basis, as general market commentary, and do not constitute investment advice. The market commentary has not been prepared in accordance with legal requirements designed to promote the independence of investment research, and it is therefore not subject to any prohibition on dealing ahead of dissemination. Although this commentary is not produced by an independent source, FXCM takes all sufficient steps to eliminate or prevent any conflicts of interest arising out of the production and dissemination of this communication. The employees of FXCM commit to acting in the clients' best interests and represent their views without misleading, deceiving, or otherwise impairing the clients' ability to make informed investment decisions. For more information about the FXCM's internal organizational and administrative arrangements for the prevention of conflicts, please refer to the Firms' Managing Conflicts Policy. Please ensure that you read and understand our Full Disclaimer and Liability provision concerning the foregoing Information, which can be accessed on the website.

DowJones Bullish & Bearish Pivots In PlayIn this update we review the recent price action in in the Dow Jones futures contract and identify the next high probability trading opportunities and price objectives to target

E-MINI DOW JONES FUTURES (YM1!), H1 Potential for Bullish RiseType : Bullish Rise
Resistance : 31872
Pivot: 30931
Support : 30412
Preferred Case: On the H4, with price moving above the ichimoku cloud and within the ascending channel, we have a bullish bias that price will rise from the pivot at 30931 in line with the pullback support and 38.2% fibonacci retracement to the 1st resistance at 31872 where the swing high resistance and 78.6% fibonacci projection are.
Alternative scenario: Alternatively, price may break pivot and drop to the 1st support level at 30412 in line with the swing low support and 78.6% fibonacci retracement.
Fundamentals: No Major News

Trying to understand spreads betterNeed help understanding these spread futures charts. The daily time frame and the hourly time frames show different prices. In the picture I drew a ray going across at 961, on the daily you can see may 18th it hit the ray, on the hourly it did not. So which one was right? I have been wanting to put alerts on here, but the alerts are going off all over the place, I cant tell whats real and whats not.

E-MINI DOW JONES ($5) FUTURESA very strong descent and now we are seeing a strong correction and then we may see a strong movement and we need patience and we are likely to get a strong and fast landing if the lower demand area breaks.

DJI Potential rise | 4th July 2022On the H4, with price moving along an ascending channel and expected to break out of the ichimoku cloud, we have a bullish bias that price will rise from our 1st support at 30862 where the horizontal pullback support and 38.2% Fibonacci retracement are to our 1st resistance at 31866 in line with the horizontal swing high resistance and 61.8% fibonacci retracement. Alternatively, price may break 1st support and head for 2nd support at 30149 where the horizontal swing low support and 78.6% fibonacci retracement are. Take note we are waiting for the break of the 1st resistance to confirm the bullish move.
Any opinions, news, research, analyses, prices, other information, or links to third-party sites contained on this website are provided on an "as-is" basis, as general market commentary, and do not constitute investment advice. The market commentary has not been prepared in accordance with legal requirements designed to promote the independence of investment research, and it is therefore not subject to any prohibition on dealing ahead of dissemination. Although this commentary is not produced by an independent source, FXCM takes all sufficient steps to eliminate or prevent any conflicts of interest arising out of the production and dissemination of this communication. The employees of FXCM commit to acting in the clients' best interests and represent their views without misleading, deceiving, or otherwise impairing the clients' ability to make informed investment decisions. For more information about the FXCM's internal organizational and administrative arrangements for the prevention of conflicts, please refer to the Firms' Managing Conflicts Policy. Please ensure that you read and understand our Full Disclaimer and Liability provision concerning the foregoing Information, which can be accessed on the website.

Showcase: Upward Trend in e-mini Dow (5mins chart, 22-07-04)1. Price was on the uptrend with the low getting higher and price increase accompanied by increase in volume.
2. Entered Long with a wider SL but TP @ next Resistance level.
3. Will share the outcome of the trade in the comment.

US30USD YM1! DOW 2022 JULY 04 Week
US30USD YM1! DOW 2022 JULY 04 Week
Scenario1 short last week was good.
Market did not reach bottom of channel, temporary return of strength
Possible scenarios:
1) Channel resistance = short
2) Market rotation = trade at boundary of range
3) Behavior change senario
4) Trend continuation - channel boundary trades
Price reaction levels
Short on Test and Reject | Long on Test and Accept
32563 31867
30406 29639 26212
Weekly: Ave volume down bar close in middle = indecisive
Daily: Ave vol up bar close at high = minor strength
H4: Ave vol up bar close off high = weakness
Remember to like and follow if you find this useful.
Have a profitable week ahead.

YM1! - Weekly Market Update, 7/5/22Index Futures traded rangebound this past week, locked between support and resistance.
No actionable ideas at this time, while the bias remains to the short side.
I've adjusted support and resistance structures accordingly for your review.
