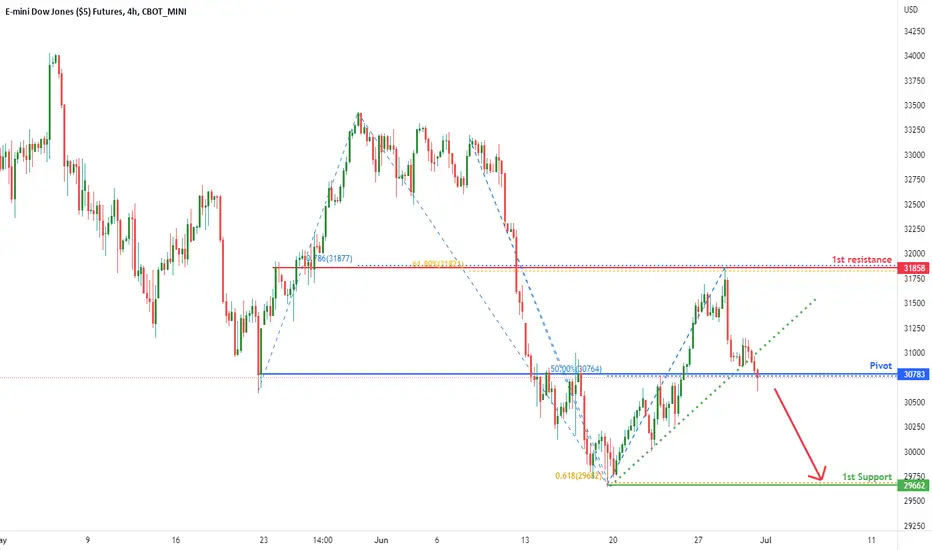
Potential Bearish ContinuationOn the H4, with price recently breaking the ascending trendline, we have a bearish bias that price will drop from the pivot at 30783 in line with the overlap resistance and 50% fibonacci retracement to the 1st support at 29662 at the swing low in line with the 61.8% fibonacci projection. Alternatively, price may reverse off the pivot and rise to the 1st resistance at 31858 at the pullback swing high in line with the 61.8% fibonacci retracement and 78.6% fibonacci projection.
DJIA1! trade ideas
DOW 4hour : looking for buy , dont pick sell as predict before dow touch fibo 61% , now if low not break it can go to EMA200 daily (orange big line) 33400 is dow next target
now we can buy with SL in low , hold it 7-8 day to 33400
good luck , use very very low size

E-MINI DOW JONES FUTURES (YM1!), H1 Potential for Bullish RiseType : Bullish Rise
Resistance : 32508
Pivot: 31698
Support : 31008
Preferred Case: On the H1, price is moving above the ichimoku cloud and is moving along ascending trendline which supports our bullish bias that price will rise to the pivot at 31698 where the swing high resistance, 161.8% fibonacci extension and 61.8% fibonacci retracement are. Once we have upside confirmation, we would expect bullish momentum to carry price to 1st resistance at 32508 in line with pullback resistance, 61.8% fibonacci projection and 78.6% fibonacci retracement .
Alternative scenario: Alternatively, price could drop to 1st support at 31008 in line with the pullback support and 38.2% fibonacci retracement .
Fundamentals: No major news

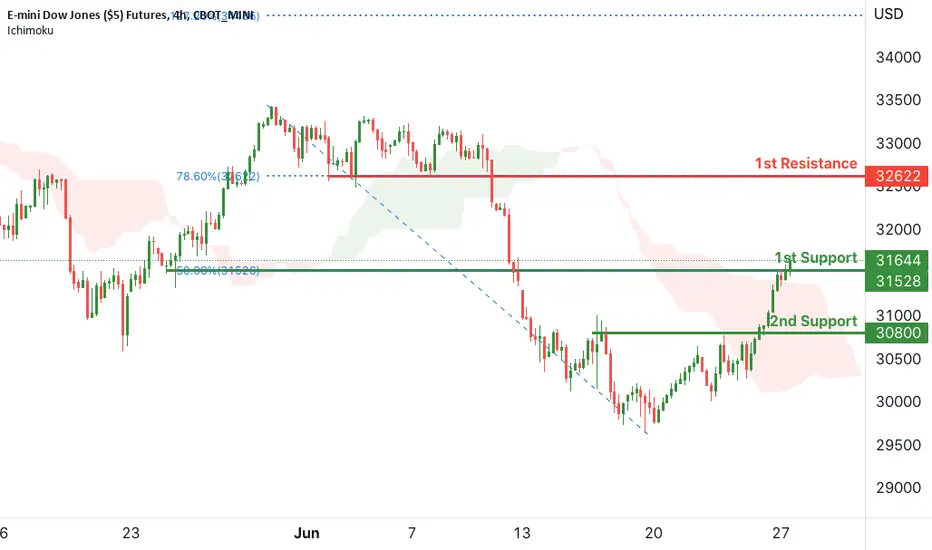
Dow Jones Potential bullish rise | 27th June 2022On the H4, with price breaking the ichimoku cloud, we have a bullish bias that price will rise from our 1st support at 31528 where the 50% Fibonacci retracement is to our 1st resistance at 32622 in line with the horizontal pullback resistance and 78.6% Fibonacci retracement. Alternatively, price may break structure and head for 2nd support where the horizontal pullback support.
Any opinions, news, research, analyses, prices, other information, or links to third-party sites contained on this website are provided on an "as-is" basis, as general market commentary, and do not constitute investment advice. The market commentary has not been prepared in accordance with legal requirements designed to promote the independence of investment research, and it is therefore not subject to any prohibition on dealing ahead of dissemination. Although this commentary is not produced by an independent source, FXCM takes all sufficient steps to eliminate or prevent any conflicts of interest arising out of the production and dissemination of this communication. The employees of FXCM commit to acting in the clients' best interests and represent their views without misleading, deceiving, or otherwise impairing the clients' ability to make informed investment decisions. For more information about the FXCM's internal organizational and administrative arrangements for the prevention of conflicts, please refer to the Firms' Managing Conflicts Policy. Please ensure that you read and understand our Full Disclaimer and Liability provision concerning the foregoing Information, which can be accessed on the website.
YM1! Short PositionAccording to my strategy YM1! will encounter following scenario in Bearish market:
Sell Limit 1: 32350
Sell Limit 2: 32500
Sell Limit 3: 32900
Tp1: 31250
Tp2: 30175
Tp3: 29700
SL: 33400
R/R: 7
You Can make profitable trades only if you be careful about your MONEY MANAGEMENT Strategy
Patience is the key of making money.

US30USD YM1! DOW 2022 JUNE 27 Week
US30USD YM1! DOW 2022 JUNE 27 Week
Scenario2 channel & 29639 support provided long opportunity last week.
Daily TF cautioned of possible trap for long. If Weekly TF reveral pattern is to exert
influence, would prefer then a long on retracement when price finds support at
lower levels.
Possible scenarios:
1) Channel resistance + test of previous breakdown area - will short if resisted
2) test of 30683 / 30100 and if supported = long.
Price reaction levels
Short on Test and Reject | Long on Test and Accept
32563 31299 30999
30157 29639 26212
Weekly: Ave vol up bar close at high = minor strength (and reversal pattern)
Daily: Low vol up bar close at high = Caution, may be trap for long
H4: Ave vol up bar close off high = weakness
Remember to like and follow if you find this useful.
Have a profitable week ahead.

DOW - YM Ketchup28.2K and 24K await... it's simply a matter of time.
Industrials for the Post Industrial Co-Dependent Economy
are being Sold as if there is no tomorrow...
Nothing like a solid lift to re-enter the Trend, which is Down.
Counter-Trends are nasty Bed Fellows.
3M, Dow, and a great many of the glory days Equities are
being dumped on the heads of Ma n' Pa.
Dividend-paying Junk Co frankly makes sense for them... for now.
CD Rates did not decline in the most recent TNX Pullback.
Banks are now more hated than ever.
Brokers are in the lead, though as Passives are frankly the new Index
Funds of the early 2000s - CLick this and that, whammy, Ron Burgundy
would be proud.
Stay Classy INDU.
Stay Classy.
YM1! - Weekly Market Update, 6/27This week's hand drawn support and resistance channel analysis has been applied to the chart for your reference.
The darker the color, the older the structure. The lighter the color, the newer the structure.
Wishing you a blessed and profitable week ahead!

DJI Short Setup & Measured Move to ~32kDow Jones Industrial Average is overbought. I can tell without using RSI or any other momentum indicator. Thus, we have our short setup for this week.
The ellipses point towards a very steep angle down, which could serve as a prime example for how far it can move vertically downward on peak selling. This can be very useful when measuring subsequent projected moves for future shorting and could offer some valuable insight into what kind of Elliott Wave correction might be forming on the monthly chart.
I'm already long DIA Puts held over the weekend, but Ill be adding to these two specific strikes/expirations if there's any sort of opening pullback upward. See below for details:
Contract 1 - Long DIA Put (1/3rd Total Position) - 342 Strike, 1/28 Expiration
Contract 2 - Long DIA Put (2/3rd Total Position) - 340 Strike, 2/4 Expiration
For those new to my options plays, I only list the speculative long positions that I have and not the short call positions that I intend to open because most do not have access to such methods. I will be shorting the calls two bucks above the open for 1/28 exp.
Anywho, the elliptical geometry seems to be leaning towards an incredible 5000 point measured move down vector that will likely start and end in the same trading day! Unless that triggers a circuit breaker on an equivalent move down in SPX, itll be an all time record for sure.
-Ellipti-Pig
DJ:DJI
SP:SPX
CURRENCYCOM:US30
CURRENCYCOM:US500
AMEX:DIA
AMEX:SPY

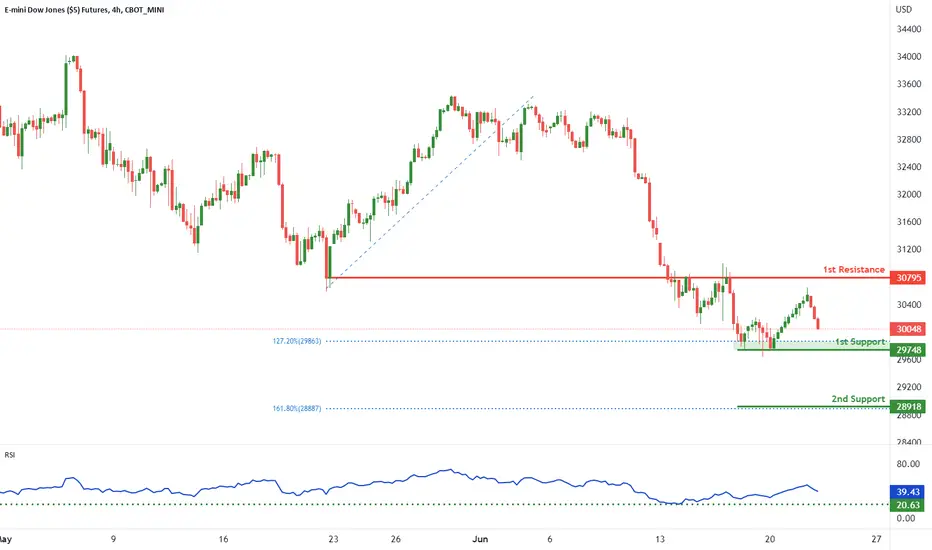
DJI Potential bearish drop | 24 June 2022On the H4, with price expected to reverse off the ichimoku cloud resistance, we have a bearish bias that price will drop from our 1st resistance at 30795 where the horizontal pullback resistance is to our 1st support at 29748 in line with the horizontal swing low support. Alternatively, price may head for 2nd resistance where the horizontal pullback resistance and 50% Fibonacci retracement is.
Any opinions, news, research, analyses, prices, other information, or links to third-party sites contained on this website are provided on an "as-is" basis, as general market commentary, and do not constitute investment advice. The market commentary has not been prepared in accordance with legal requirements designed to promote the independence of investment research, and it is therefore not subject to any prohibition on dealing ahead of dissemination. Although this commentary is not produced by an independent source, FXCM takes all sufficient steps to eliminate or prevent any conflicts of interest arising out of the production and dissemination of this communication. The employees of FXCM commit to acting in the clients' best interests and represent their views without misleading, deceiving, or otherwise impairing the clients' ability to make informed investment decisions. For more information about the FXCM's internal organizational and administrative arrangements for the prevention of conflicts, please refer to the Firms' Managing Conflicts Policy. Please ensure that you read and understand our Full Disclaimer and Liability provision concerning the foregoing Information, which can be accessed on the website.

DJI Potential bearish drop | 23rd June 2022On the H4, with price moving below the ichimoku cloud, we have a bearish bias that price will rise from our 1st resistance at 30795 where the horizontal pullback resistance is to our 1st support at 29748 in line with the horizontal swing low support. Alternatively, price may head for 2nd resistance where the horizontal pullback resistance and 50% Fibonacci retracement is.
Any opinions, news, research, analyses, prices, other information, or links to third-party sites contained on this website are provided on an "as-is" basis, as general market commentary, and do not constitute investment advice. The market commentary has not been prepared in accordance with legal requirements designed to promote the independence of investment research, and it is therefore not subject to any prohibition on dealing ahead of dissemination. Although this commentary is not produced by an independent source, FXCM takes all sufficient steps to eliminate or prevent any conflicts of interest arising out of the production and dissemination of this communication. The employees of FXCM commit to acting in the clients' best interests and represent their views without misleading, deceiving, or otherwise impairing the clients' ability to make informed investment decisions. For more information about the FXCM's internal organizational and administrative arrangements for the prevention of conflicts, please refer to the Firms' Managing Conflicts Policy. Please ensure that you read and understand our Full Disclaimer and Liability provision concerning the foregoing Information, which can be accessed on the website.

Dow Jones to test resistance - Possible short Resistance will be tested soon - A rejection will give us a short opportunity

Dow Jones potential for a drop! | 22nd June 2022On the H4, with price expected to bounce off the stochastics indicator, we have a bullish bias that price will rise from our 1st support at 29748 where the 127.2% Fibonacci extension is to our 1st resistance at 30795 in line with the horizontal pullback support. Alternatively, price may break structure and head for 2nd support where the 161.8% Fibonacci extension is.
Any opinions, news, research, analyses, prices, other information, or links to third-party sites contained on this website are provided on an "as-is" basis, as general market commentary, and do not constitute investment advice. The market commentary has not been prepared in accordance with legal requirements designed to promote the independence of investment research, and it is therefore not subject to any prohibition on dealing ahead of dissemination. Although this commentary is not produced by an independent source, FXCM takes all sufficient steps to eliminate or prevent any conflicts of interest arising out of the production and dissemination of this communication. The employees of FXCM commit to acting in the clients' best interests and represent their views without misleading, deceiving, or otherwise impairing the clients' ability to make informed investment decisions. For more information about the FXCM's internal organizational and administrative arrangements for the prevention of conflicts, please refer to the Firms' Managing Conflicts Policy. Please ensure that you read and understand our Full Disclaimer and Liability provision concerning the foregoing Information, which can be accessed on the website.
2 Steps in Drawing a Downtrend Channel A buying strategy in a downtrend.
How to identify buying opportunity in a downtrend?
Not my preference to buy in a downtrend, but that does not mean we should avoid it when buying opportunity arises.
Recognizing it is a downtrend, we keep our buy position short-term; as we are going against the trend.
Discussion: Rules in constructing a downtrend parallel trendline
Rule 1 – First the downtrend line
Rule 2 – Then, its parallel
Disclaimer:
• What presented here is not a recommendation, please consult your licensed broker.
• Our mission is to create lateral thinking skills for every investor and trader, knowing when to take a calculated risk with market uncertainty and a bolder risk when opportunity arises.

DJI potential for rise! | 21st June 2022On the H4, with price expected to bounce off the stochastics indicator, we have a bullish bias that price will rise from our 1st support at 29748 where the 127.2% Fibonacci extension is to our 1st resistance at 30795 in line with the horizontal pullback support. Alternatively, price may break structure and head for 2nd support where the 161.8% Fibonacci extension is.
Any opinions, news, research, analyses, prices, other information, or links to third-party sites contained on this website are provided on an "as-is" basis, as general market commentary, and do not constitute investment advice. The market commentary has not been prepared in accordance with legal requirements designed to promote the independence of investment research, and it is therefore not subject to any prohibition on dealing ahead of dissemination. Although this commentary is not produced by an independent source, FXCM takes all sufficient steps to eliminate or prevent any conflicts of interest arising out of the production and dissemination of this communication. The employees of FXCM commit to acting in the clients' best interests and represent their views without misleading, deceiving, or otherwise impairing the clients' ability to make informed investment decisions. For more information about the FXCM's internal organizational and administrative arrangements for the prevention of conflicts, please refer to the Firms' Managing Conflicts Policy. Please ensure that you read and understand our Full Disclaimer and Liability provision concerning the foregoing Information, which can be accessed on the website.

DOW daily : looking for buy with SL in low , hold it 7-8 day personaly i belive dow will see EMA200 daily 33500 soon
BUY BUT 100% PUT SL IN LOW , NEVER REMOVE SL , dont close buy soon , after +80 point ,move SL to open price,let it go
if dow break low (need bad news) above green arrow (next posible low) when pinbar comes we can buy and hold to high
good luck
