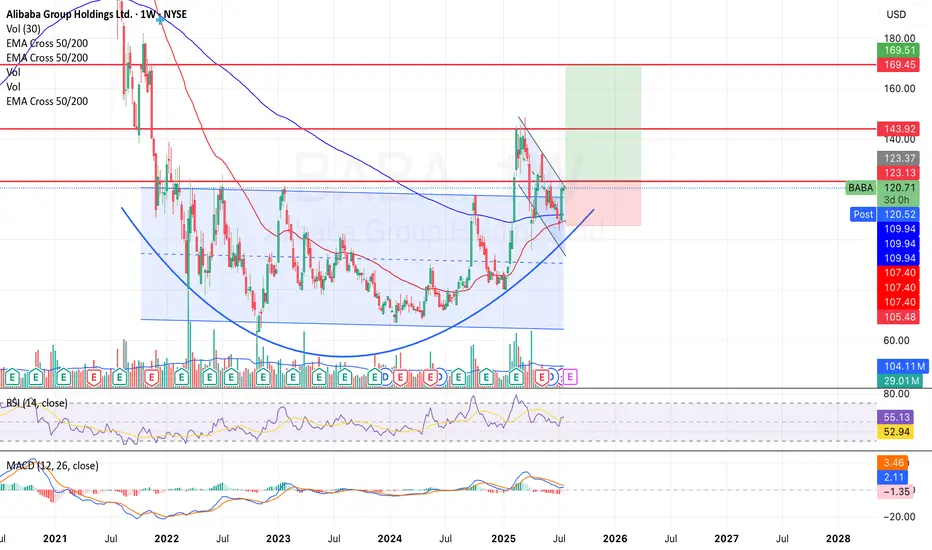
Much needed break for $BABA on the horizonI took a much needed break but not as long as NYSE:BABA has taken since 2021; swinging between ~$70 and ~$120 over the past six years.
I strongly suspect that this might have something to do with Jack Ma's speech in late 2024 that made him go 'missing' from public view
- www.wired.com .
The s
Next report date
—
Report period
—
EPS estimate
—
Revenue estimate
—
0.96 USD
17.96 B USD
138.21 B USD
16.56 B
About Alibaba Group Holdings Ltd.
Sector
Industry
CEO
Yong Ming Eddie Wu
Website
Headquarters
Hangzhou
Founded
1999
FIGI
BBG00QZ8C2L5
Alibaba Group Holding Ltd. engages in providing technology infrastructure and marketing reach. It operates through the following business segments: China Commerce, International Commerce, Local Consumer Services, Cainiao, Cloud, Digital Media and Entertainment, and Innovation Initiatives and Others segments. The Core Commerce segment consists of platforms operating in retail and wholesale. The China Commerce segment includes China commerce retail and wholesale businesses. The International Commerce segment focuses on international commerce retail and wholesale businesses. The Local Consumer Services segment is involved in To-Home businesses, which include Ele.me, local services and delivery platform, and Taoxianda, and To-Destination segment businesses which include Amap, the provider of mobile digital map, navigation and real-time traffic information, and restaurant and local services guide platform. The Cainiao segment has Cainiao Network and offers domestic and international one-stop-shop logistics services and supply chain management solution. The Cloud segment includes Alibaba Cloud and DingTalk. The company was founded by Chung Tsai and Yun Ma on June 28, 1999 and is headquartered in Hangzhou, China.
Related stocks
BABA is a BUY BUYDowntrend break in play, wedge forming. We should break through resistance of 128 and test all time highs in high $140's in the next few weeks

Alibaba - A remarkable reversal!🛒Alibaba ( NYSE:BABA ) reversed exactly here:
🔎Analysis summary:
Recently Alibaba has perfectly been respecting market structure. With the current bullish break and retest playing out, there is a very high chance that Alibaba will rally at least another +20%. But all of this chart behaviour j

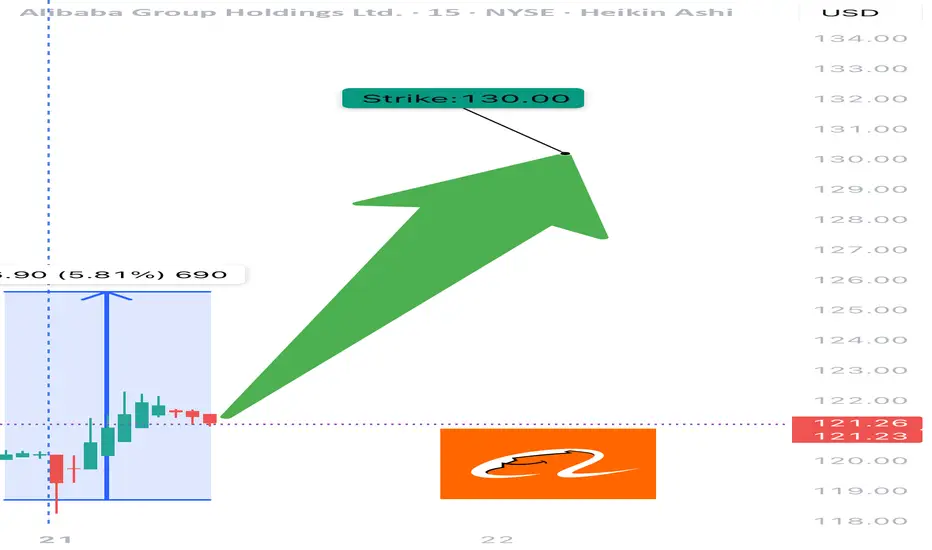
BABA WEEKLY TRADE IDEA – JULY 21, 2025
🐉 NYSE:BABA WEEKLY TRADE IDEA – JULY 21, 2025 🐉
📈 Strong RSI. Institutional Accumulation. Gamma-juiced upside.
Momentum is building — timing is key.
⸻
📊 Trade Setup
🔹 Type: Long Call
🎯 Strike: $130.00
📆 Expiry: July 25, 2025 (4 DTE)
💰 Entry Price: $0.52
🎯 Profit Target: $0.74 (📈 +42%)
🛑 Stop Lo
BABA: triangle with tensionOn the weekly chart, BABA has already formed a golden cross - price is above both MA50 and MA200, confirming a bullish trend shift. The stock is now approaching the upper edge of the symmetrical triangle and the key resistance at $122, which also aligns with the 0.5 Fibonacci level.
The numbers ins

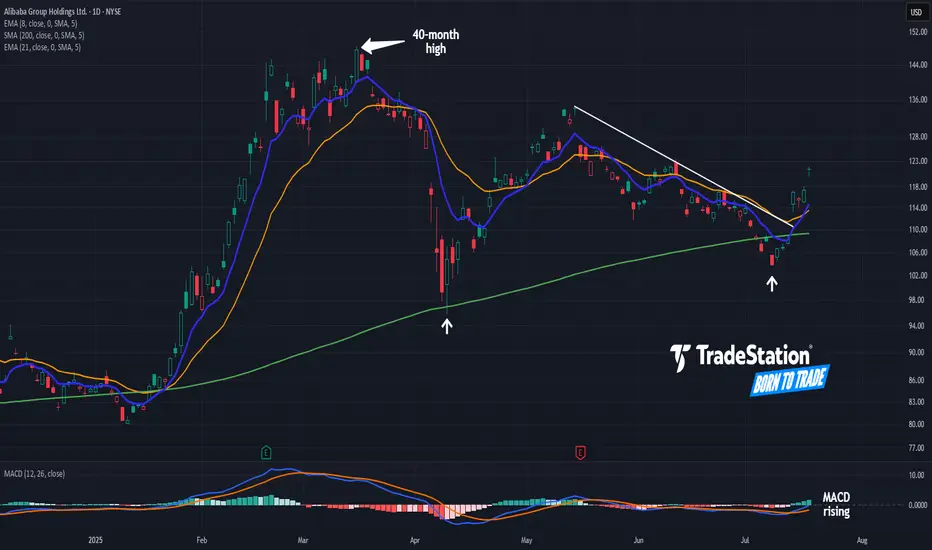
Alibaba Breaks a TrendlineAlibaba began 2025 with a big rally. Now, after a long pullback, some traders may see further upside in the Chinese tech giant.
The first pattern on today’s chart is the pair of higher lows (marked with white arrows) along the rising 200-day simple moving average. Those may reflect the development
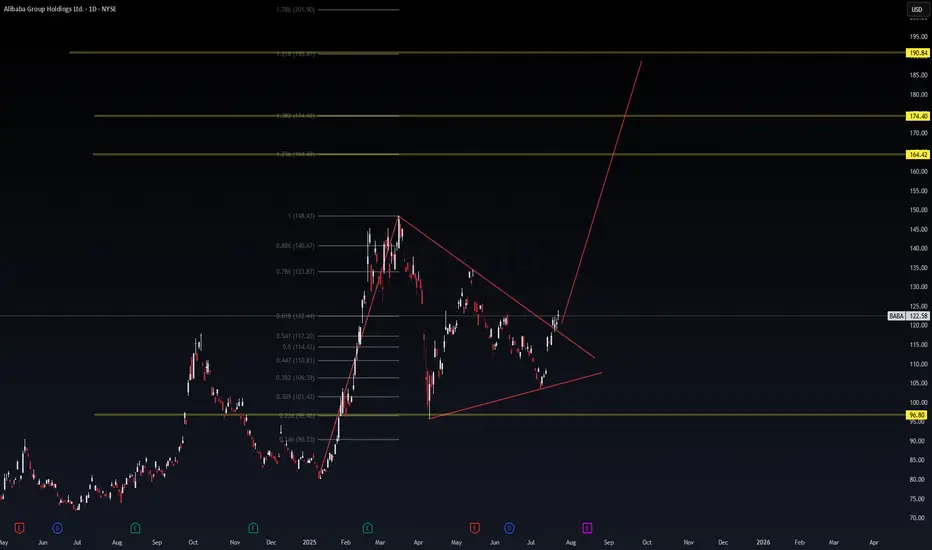
$BABA Breakout Imminent – Triangle Compression Ending, Fib .....📈 NYSE:BABA Breakout Imminent – Triangle Compression Ending, Fib Confluence Targets Set
After weeks of coiling inside a converging triangle, Alibaba ( NYSE:BABA ) just broke above the downtrend line with conviction. The structure and Fibonacci extensions point toward an explosive leg up—possibly
Long $BABA - NYSE:BABA is testing 200 SMA
- NYSE:BABA moves are explodes higher then cools then retest support then explodes higher than the last high. It's called trading with higher wavelength
-> Move 1: Started April 2024 when the trend reversal started. $68 -> $89 with around +30% then retraced $9

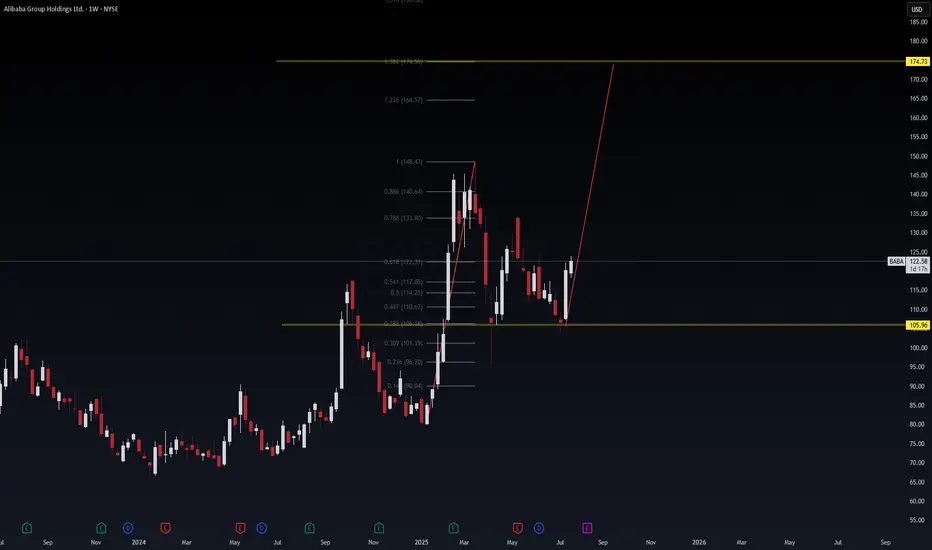
BABA | Weekly VolanX Setup📈 BABA | Weekly VolanX Setup
WaverVanir International LLC | July 24, 2025
Alibaba is bouncing off a key institutional demand zone at 105.96, reclaiming the .382 Fibonacci level with strong bullish conviction. This weekly structure sets the stage for a macro Fibonacci extension run toward 174.73 — a
BABA: What are you seeing on this chart?BABA:
.
What are you seeing on this chart?
A perfect shakeout.
Smart money has joined at the bottom.
What's next?
.
US STOCKS- WALL STREET DREAM- LET'S THE MARKET SPEAK!

See all ideas
Summarizing what the indicators are suggesting.
Neutral
SellBuy
Strong sellStrong buy
Strong sellSellNeutralBuyStrong buy
Neutral
SellBuy
Strong sellStrong buy
Strong sellSellNeutralBuyStrong buy
Neutral
SellBuy
Strong sellStrong buy
Strong sellSellNeutralBuyStrong buy
An aggregate view of professional's ratings.
Neutral
SellBuy
Strong sellStrong buy
Strong sellSellNeutralBuyStrong buy
Neutral
SellBuy
Strong sellStrong buy
Strong sellSellNeutralBuyStrong buy
Neutral
SellBuy
Strong sellStrong buy
Strong sellSellNeutralBuyStrong buy
Displays a symbol's price movements over previous years to identify recurring trends.
Curated watchlists where BABAF is featured.


Frequently Asked Questions
The current price of BABAF is 15.82 USD — it has increased by 3.47% in the past 24 hours. Watch Alibaba Group Holding Limited stock price performance more closely on the chart.
Depending on the exchange, the stock ticker may vary. For instance, on OTC exchange Alibaba Group Holding Limited stocks are traded under the ticker BABAF.
BABAF stock has risen by 7.15% compared to the previous week, the month change is a 8.68% rise, over the last year Alibaba Group Holding Limited has showed a 72.29% increase.
We've gathered analysts' opinions on Alibaba Group Holding Limited future price: according to them, BABAF price has a max estimate of 22.06 USD and a min estimate of 13.37 USD. Watch BABAF chart and read a more detailed Alibaba Group Holding Limited stock forecast: see what analysts think of Alibaba Group Holding Limited and suggest that you do with its stocks.
BABAF reached its all-time high on Oct 30, 2020 with the price of 41.17 USD, and its all-time low was 7.35 USD and was reached on Oct 24, 2022. View more price dynamics on BABAF chart.
See other stocks reaching their highest and lowest prices.
See other stocks reaching their highest and lowest prices.
BABAF stock is 5.44% volatile and has beta coefficient of 1.61. Track Alibaba Group Holding Limited stock price on the chart and check out the list of the most volatile stocks — is Alibaba Group Holding Limited there?
Today Alibaba Group Holding Limited has the market capitalization of 268.80 B, it has increased by 10.26% over the last week.
Yes, you can track Alibaba Group Holding Limited financials in yearly and quarterly reports right on TradingView.
Alibaba Group Holding Limited is going to release the next earnings report on Aug 14, 2025. Keep track of upcoming events with our Earnings Calendar.
BABAF earnings for the last quarter are 0.22 USD per share, whereas the estimation was 0.21 USD resulting in a 1.69% surprise. The estimated earnings for the next quarter are 0.27 USD per share. See more details about Alibaba Group Holding Limited earnings.
Alibaba Group Holding Limited revenue for the last quarter amounts to 32.88 B USD, despite the estimated figure of 32.91 B USD. In the next quarter, revenue is expected to reach 35.45 B USD.
BABAF net income for the last quarter is 1.70 B USD, while the quarter before that showed 6.81 B USD of net income which accounts for −75.03% change. Track more Alibaba Group Holding Limited financial stats to get the full picture.
Yes, BABAF dividends are paid annually. The last dividend per share was 0.25 USD. As of today, Dividend Yield (TTM)% is 0.87%. Tracking Alibaba Group Holding Limited dividends might help you take more informed decisions.
Alibaba Group Holding Limited dividend yield was 0.80% in 2024, and payout ratio reached 13.85%. The year before the numbers were 1.39% and 22.64% correspondingly. See high-dividend stocks and find more opportunities for your portfolio.
As of Jul 27, 2025, the company has 124.32 K employees. See our rating of the largest employees — is Alibaba Group Holding Limited on this list?
EBITDA measures a company's operating performance, its growth signifies an improvement in the efficiency of a company. Alibaba Group Holding Limited EBITDA is 25.24 B USD, and current EBITDA margin is 17.78%. See more stats in Alibaba Group Holding Limited financial statements.
Like other stocks, BABAF shares are traded on stock exchanges, e.g. Nasdaq, Nyse, Euronext, and the easiest way to buy them is through an online stock broker. To do this, you need to open an account and follow a broker's procedures, then start trading. You can trade Alibaba Group Holding Limited stock right from TradingView charts — choose your broker and connect to your account.
Investing in stocks requires a comprehensive research: you should carefully study all the available data, e.g. company's financials, related news, and its technical analysis. So Alibaba Group Holding Limited technincal analysis shows the buy rating today, and its 1 week rating is strong buy. Since market conditions are prone to changes, it's worth looking a bit further into the future — according to the 1 month rating Alibaba Group Holding Limited stock shows the buy signal. See more of Alibaba Group Holding Limited technicals for a more comprehensive analysis.
If you're still not sure, try looking for inspiration in our curated watchlists.
If you're still not sure, try looking for inspiration in our curated watchlists.