BABA BULLISH SCENARIOAlibaba has decided not to join the share buyback of its fintech arm, Ant Group. Ant Group remains an important partner, and Alibaba wants to maintain its shareholding. The buyback was initiated following Beijing's crackdown on web giants, with Ant Group receiving a substantial fine. Alibaba's stock value in Ant Group remains lower than in 2020 when an IPO was canceled. Speculation arises about a potential IPO retry, but significant changes have occurred since then, including Alibaba's split into six companies and a reshuffling of its executive leadership. Earnings anticipations set BABA in a good direction.
Risk Disclosure: Trading Foreign Exchange (Forex) and Contracts of Difference (CFD's) carries a high level of risk. By registering and signing up, any client affirms their understanding of their own personal accountability for all transactions performed within their account and recognizes the risks associated with trading on such markets and on such sites. Furthermore, one understands that the company carries zero influence over transactions, markets, and trading signals, therefore, cannot be held liable nor guarantee any profits or losses.
BABAF trade ideas

BABA [Alibaba] 4H ( Bullish Scenario) BABA on the daily timeframe are showing favorable conditions. If the $100 resistance level is broken, it could potentially lead to higher figures. However, in case of a rejection from this level, the stock might undergo a correction towards the support areas at $95 and $91 before resuming its upward movement.

Alibaba low risk high profit set up
NYSE:BABA
Alibaba is at demand zone currently testing the down trend price channel which it broke out from it earlier and tested the higher levels now retraced taking support at demand zone go long low risk high profit trade,

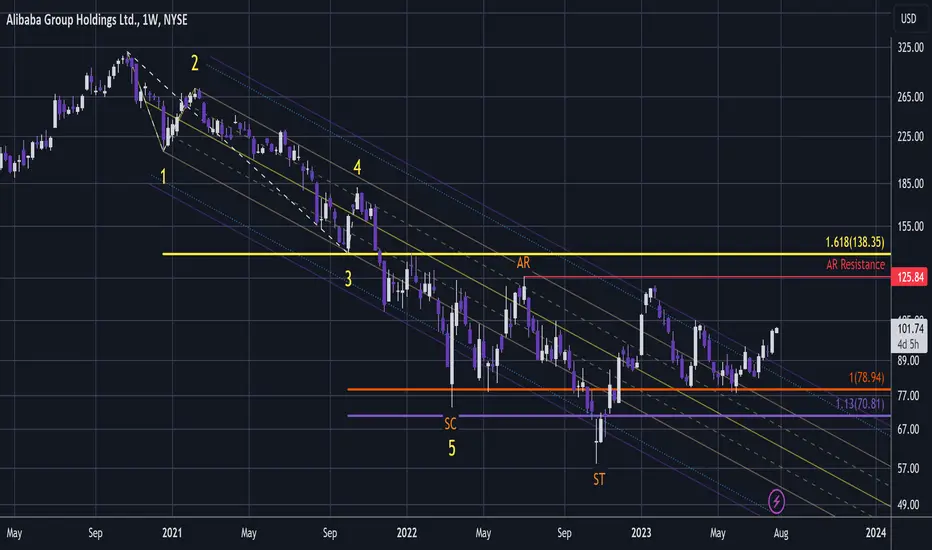
BABA - Yet Another Great Market DishThe markets are dishing up great buys for those with eyes to see.
Have been watching this one a long time and the bear market was a classic Elliott Wave 1:1.618:1 which revealed the impulsive SC Selling Climax low.
The first clue that the accumulation was entering the end phase was moving out of the Pitchfork that has held price for so long.
We have made out first entries upon the first weekly candle close outside of the Pitchfork outer warning line.
Now this is breaking out, this will likely go on to engulf the previous high as it moves through a lucrative bull market.
Could yet see a pull back as it is still well within the larger AR Automatic Rally accumulative range and if it does we'll be looking to buy the dip at a significant landmark.
Not advice.
BABA $105 strike volume = 20,784 and Open int.= 36,8 AUG 11-25BABA seems to be moving accordingly to my due diligence a couple weeks back...institutional and retail money appears to be stockpiling at strike $105 ...I anticipate a pullback around $101.5...if this happens then these $105 strike contracts everyone loving could go on sale for me and you.


$BABA INVERSE HEAD & SHOULDERS - DAILY.NYSE:BABA
Inverse Head and shoulders forming on the NYSE:BABA daily. Could run up to 105 and if that resistance is broken and becomes support, could then run to 121. Trade safe!

Alibaba Group Holding buying opportunityAlibaba is potentially in the process of making a head and shoulder patten.
Break of neckline should be with heavy volume to be successful.

BABA heading back to 200 +100% gainWith this being beaten up for years, the monthly looks to be building a support finally.
I usually try to stay away from chinese stocks, but I am long here

$BABA Inverse Head & ShoulderNYSE:BABA Inverse Head & Shoulder. The inverse head and shoulders pattern is a bullish reversal pattern that is often seen in stocks that have been in a downtrend. The pattern is characterized by three troughs, with the middle trough being lower than the other two. The neckline is the horizontal line that connects the bottoms of the two outer troughs.
If the price of BABA breaks above the neckline, it would be a signal that the downtrend is over and that the stock is likely to move higher. The target price for the breakout would be the distance between the neckline and the head of the pattern.
Of course, no pattern is guaranteed, and there is always the possibility that BABA could break down below the neckline instead. However, the inverse head and shoulders pattern is a bullish signal that is worth watching for.

BABA 120 within 30 daysBABA is keeping its stance pretty well, which it rarely does. I predict it will reach 120 in less than 30 days. Tomorrow, maybe we will see a two digits gain. The 120 call is 0.5 dollars. It is going to 10-X at least..

BABA LongRejected today at the trendline, continues to consolidate on the weekly. Once it breaks over $100 it should start a large move towards $157.83

Here's Why $BABA Could Skyrocket Even Higher!Analysis:
Looking at the dataset, it's evident that both the Macro PVVM and Micro PVVM scores for Alibaba ( NYSE:BABA ) show an overall increasing trend over the examined period. The Macro PVVM went from a score of around 0.58 to approximately 54.24, demonstrating a significant uptrend. The Micro PVVM also moved from -53.71 to 40.23, showing a reversal from a bearish to a bullish momentum in the short term.
The close price of NYSE:BABA has been generally increasing along with the PVVM scores, indicating that the bullish momentum has been affecting the stock's price positively.
Key Takeaways:
There's an established bullish momentum, indicated by the upward trend in both the Macro and Micro PVVM.
The Micro PVVM has crossed from negative to positive, suggesting that the bearish short-term movement seen at the beginning of the period has turned into a bullish one.
The most recent close price of $98.33 is the highest over this period, further confirming the bullish sentiment.
Trading Strategy:
Given the bullish trend and movement, it would be a good strategy to maintain a long position on Alibaba. However, traders should keep an eye on the PVVM scores. If there's a sudden drop, especially in the Micro PVVM, it could indicate a reversal in the short-term movement.
Since both Macro and Micro PVVM are in positive territory and increasing, traders should look for opportunities to enter long positions on pullbacks, as the overall trend is upwards. Keep in mind the rule that the best long entries are when both PVVMs are low and start showing signs of strengthening.

$BABA Bearish to bullish reversal bottoming phaseNYSE:BABA Bearish to bullish reversal bottoming phase. The parallel down trend has ended and NYSE:BABA is currently in a bottoming pattern show on the weekly chart. This is a long term investment play that can take months before it can start to go higher.

BABAMy view of the stock BABA for the coming period may be that during the next month, the goals will be achieved

BABA running in upside channelSince BABA hit all time low in Oct 2022, it have been consistently keep above $80. The Stock show a nice consolidation and now for a short term trend it’s been running inside upward channel.
This is mainly based off on technical analysis.

LONG baba @83.97for some reason i cannot see my idea posted earlier .
BABA recently broke out of weekly downtrend off monthly demand zone.
i am long BABA from 83. first target would be 120.
140 is a key zone , if we get through 140 then upside potential is 160 and then 220.
DYOR before investing

$BABA, could it be?NYSE:BABA appears to be setting up for a nice move. I’m moving cautiously with this one due to the MACRO environment. If things continue the way they are, this may be one to keep an eye on. This is a heavy news inflated couple of weeks ahead which could cause extreme volatility.

BABA momentum shiftHolding since 91.90. can go as high as 150 will keep an eye out on how it goes.
Alibaba Group Holding Limited, or Alibaba, is a Chinese multinational technology company specializing in e-commerce, retail, Internet, and technology.

$BABA long / short ideaNYSE:BABA - Alibaba's stock is currently showing mixed signals based on its moving averages. In the short-term, there is a sell signal from the Moving Average, while the long-term Moving Average indicates a buy signal. The fact that the short-term average is above the long-term average suggests an overall buy signal for the stock, indicating a positive forecast.
However, the stock may face resistance at around $93.13 as it continues to rise, as the short-term Moving Average could hinder further gains. On the other hand, if the stock experiences a decline, it is likely to find support at approximately $88.06, provided by the long-term average.
It's worth noting that a breakout above the short-term average would send a strong buy signal, while a breakdown below the long-term average would trigger a sell signal.
Additionally, the 3-month Moving Average Convergence Divergence (MACD) is indicating a buy signal, which adds to the positive sentiment for the stock.
However, there are some cautionary signs to consider. Despite the stock's price gains, the volume has fallen during the last trading day, creating a divergence between volume and price. This could be interpreted as an early warning sign and suggests that the stock should be closely monitored.
Moreover, some negative signals have also been issued, which may influence the stock's short-term development. Notably, a sell signal was issued from a pivot top point on Thursday, July 13, 2023, resulting in a decline of -4.60%. The projection indicates the possibility of further decline until a new bottom pivot is identified.
In summary, while there are positive indicators for Alibaba's stock, such as the buy signal from the long-term Moving Average and the MACD, investors should be cautious due to the divergence between volume and price, as well as the recent sell signal from the pivot top point. Monitoring the stock closely would be prudent to assess its future performance accurately.

Is it really that simple?Everyone hates china, it would be max pain for Chinese market to moon now.
Inverse H&S so obvious... held critical support, I took a small position in the support box and remain long, any pullback is a buy, closer to the support the better obviously.

China is attractive for investment again! Alibaba
Ticker: HKEX:9988 or NYSE:BABA
Entry price: 89 HGS$
Short term target: $120
Medium term target: $171
Long term target: $205
Potential return per trade: up to 125%
Volume per trade: up to 3-4% of the portfolio
🛡 It is better to hold this stock for the medium term, and use the drawdown to increase the position.
❗️Risk Level: Medium
Alibaba shares have been under pressure since November 2020.
During this period, the shares fell -72% from the maximum, although the company itself has not lost its profitability and still has a significant market share in the Chinese market.
The Chinese government made a big contribution to the fall, which strangled the company with fines and did not allow an IPO.
But now this negative has come to naught and now the road up is open for the stock 📈
According to technical analysis, the stock gives the first signals for a medium-term trend reversal.
Now the paper is at the border of the long-term ascending channel.
If it breaks through, we can expect a fairly fast and impulsive growth, which should not stagnate, but rather gain strength ⚡️
But if you want to find more ideas in great companies with high growth potential, welcome to the profile 🎩

Long BABA on confluenceLeft chart NYSE:BABA weekly
Right chart NYSE:BABA daily
Support at all time POC and AVWAPS. Rejection wick adds confidence.
Great R:R for a SL under the wick.
TP's: am looking at $93, $103 and $123
