BABA AnalysisPrice consolidated since my last analysis. No changes to my expectations, I'm expecting price to continue lower after breaking the market structure to the downside.
BABAF trade ideas

Baba wedge Doing some homework looking for a bullish hedge from something not overbought with a 60pe .
Approaching a breakout here with 2 gaps above
108
118
I'm a day trader so most likely I'll play for 108 gap close and bail but the momentum could carry this trade to 118 in 2weeks

$BABA: Trend reversal...After an impressive rally, we now have signs of a change of trend here in $BABA.
Best of luck!
Cheers,
Ivan Labrie.

ALIBABA Potential for Bullish Rise | 14th February 2023Looking at the H4 chart, my overall bias for ALIBABA is bullish due to the current price being above the Ichimoku cloud , indicating a bullish market.
Looking for a pullback buy entry at 92.85, where the overlap support is. Stop loss will be at 84.32, where the previous overlap support is. Take profit will be at 121.28, where the recent high is.
Any opinions, news, research, analyses, prices, other information, or links to third-party sites contained on this website are provided on an "as-is" basis, as general market commentary, and do not constitute investment advice. The market commentary has not been prepared in accordance with legal requirements designed to promote the independence of investment research, and it is therefore not subject to any prohibition on dealing ahead of dissemination. Although this commentary is not produced by an independent source, FXCM takes all sufficient steps to eliminate or prevent any conflicts of interest arising out of the production and dissemination of this communication. The employees of FXCM commit to acting in the clients' best interests and represent their views without misleading, deceiving, or otherwise impairing the clients' ability to make informed investment decisions. For more information about the FXCM's internal organizational and administrative arrangements for the prevention of conflicts, please refer to the Firms' Managing Conflicts Policy. Please ensure that you read and understand our Full Disclaimer and Liability provision concerning the foregoing Information, which can be accessed on the website.

Sell ideaAs you see on the chart we have a sell idea because we have the breakout with force the vwap indicator by a big red candle with a large red volume! Thanks!

BABA AnalysisPrice playing out nicely as analyzed last week. Price dropped after taking external liquidity at 120.90, producing a downtrend on the lower timeframe. My expectations are unchanged, expecting price to head lower into the bullish POI at 94.98 next.

BABA looking bullish short-term. BABA has formed a beautiful and mature in-spirit-of bull flag. A move should be excepted within the next few trading days.

BABA heading into a wall...BABA has been trading very true to its technicals the past few months and I am willing to trade it again. The chart says it all!
Good luck.

Alibaba | Fundamental AnalysisThe previous several years have been petty tough for e-commerce giant Alibaba Group, to say the least. After peaking amid the coronavirus pandemic, the company lost nearly 80% of its value over the next two years. Since then, the company has rallied, up 78% from its October 2022 low, but still a far cry from the levels that preceded the COVID-19 pandemic.
Needless to say, these have been challenging times for Alibaba and its investors. And while the company still has a considerable way to go and overcome challenges, here are a few reasons to be optimistic about Alibaba stock.
China begins to roll back quarantine restrictions
China's anti-COVID-19 policies have undoubtedly hurt Alibaba. The ban has negatively impacted China's overall economic activity, and taking into account Alibaba's size and how entrenched it is in the Chinese economy (which is the second largest in the world), it has had a direct impact on the company.
In addition to people spending less during store closures in China, this policy has also hurt Alibaba's logistics network, particularly due to road and highway closures. All of this led to the company's first-ever low YoY revenue growth in June 2022.
But there should be brighter days ahead. No one can say for sure when China will fully open its doors, but some parts of the country have begun to take steps in that direction in December last year. If the situation is similar to the U.S., a reopening in China could boost economic growth with the help of improved spending and household consumption. Alibaba should benefit from this.
Cloud business growth
Cloud infrastructure and services are becoming an important part of any business that uses the Internet for its operations. In Q3 of 2022 alone, global spending on cloud infrastructure services rose to $57 billion, bringing total spending in the past 12 months to $217 billion.
With a 5% market share, Alibaba Cloud lags behind market leaders Amazon Web Services, Microsoft Azure, and Alphabet Google Cloud (34%, 21%, and 11%, respectively), but the trend is there.
For the quarter that ended Sept. 30, 2022, Alibaba Cloud revenue grew 4% YoY to more than $2.9 billion, driven by public cloud growth. More encouraging, however, should be the growth in Alibaba Cloud's non-Internet Industry (NII) customers. The number of NII customers grew 20 percent year over year to 58 percent of total cloud revenue.
These strong results were achieved at the expense of government services, telecommunications companies, and financial services. Cloud services are integral to all three of these areas, which could lead to long-term recurring revenue for Alibaba.
The global cloud computing market is projected to reach more than $1.7 trillion by 2029, at an average annual growth rate of just under 20 percent. Even if Alibaba Cloud can't make the top three in market share, it will have plenty of room for success as it expands the overall pie.
Jack Ma's departure from Ant Group
No one was surprised when Jack Ma, Alibaba's founder, announced he was stepping down as chairman. Although Ma had led Alibaba's development and triumph, his departure did not affect the company too much because the leadership was already in new hands.
However, many were shocked when Ma announced that he was giving up control of fintech giant Ant Group, in which Alibaba has a 33% stake. Ant Group was scheduled to go public in November 2020 with a capitalization of about $37 billion, but the stock was canceled at the last minute largely because of regulatory scrutiny.
With Ma no longer controlling Ant Group, the likelihood that the company could restart its initial public offering (IPO) process has increased significantly, though it likely won't be smooth. Ant Group's IPO could bring Alibaba a large cash infusion that could be used as China's quarantine restrictions ease.
BABA AnalysisPrice playing out nicely as analyzed last week. Price filled the fair value gap at 120.90 and falls from there. If price were to follow the bearish order flow, I'm expecting price to head towards the bullish POI at 94.98 next.

BABABABA appears to be in an expanding diagonal on the HTF.
Would expect the 5th to start after 1 more dip to bring the bears back only to slaughter them later.


$BABA Still bullish on this oneI'm Still bullish on $BABA and the rest of the Chinese stocks. We're above the 2022 POC level and that is all good news. I'm keeping for a while my Chinese papers.
Cheers!

Cup and HandleLooks like a cup is forming.
There is a gap below price.
Earnings 2-23 BMO and analysts have estimated earnings to be over last quarter's numbers so the numbers are not soft.
No recommendation.
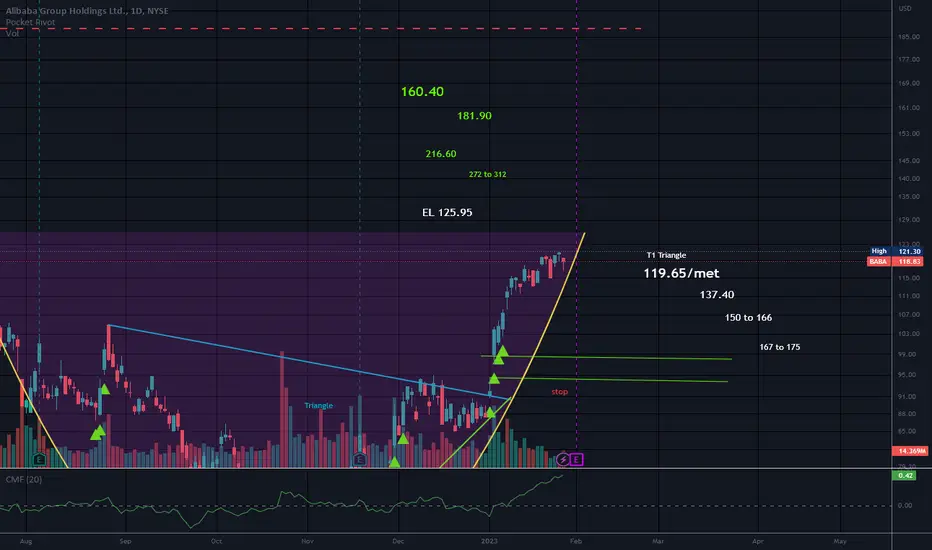
This is not to long entry level (EL). It can be important to wait for this level if you do not already own the stock.
There is also a symmetrical triangle and targets are in white type with T1 in larger type (T1 has been met) than T2 and so on. In order to reach T2 of the triangle, BABA will have to break the cup resistance.
BABA Short IdeaGood setup for a short. Equity reached highs of the last run and starting to stumble while market ripping and showing some reversial potential here. Also not surprising is that it was one of the leaders in the up move and now is signalling where the market may go next. Red line SL, green lines TP 1, and 2, respectively. GL

BABA Breaking out!! Wait for pullback !BABA has broken out and currently retesting the RESISTANCE ZONE @ 120 - 140
We can expect at least a slight pullback from here as Price action has been overly bullish the past few days + MACD is in severely overbought condition
We are expecting a soon to be GOLDEN CROSS with 50 MA crossing 200 MA
We also see a massive spike in the ADX implying a very strong ongoing trend for the BULLS
Those who do not have positions yet can look to ENTER/LONG along the:
100 - 110 USD zone
Personally I will not set stop losses here as Im expecting to hold BABA for long
Fundamentally, China domestic demand is growing massively with a massive middle class. BABA also has a huge economic moat along with Jack Ma relinquishing his position on the board and staying low, BABA's days of billion dollar fines might be over.

BABA AnalysisPrice consolidated since my analysis last week. No changes in my expectations. I'm expecting a confirmation on the lower timeframe to bring price lower, into the bullish POI at 94.98.

QuickTrade Idea n. 271 on BABAI am Bullish above $120.6 with target at $122.77
I am Bearish below $117.12 with target at $114.98

Trading Idea 020: AlibabaMarket Conditions:
- bullish trend
- consolidation around the resistance
- bullish sentiment in the market
Key Level and Lines:
- $120.30 resistance
Trading Ideas:
- go long after a consolidation below the resistance
- go short if the market gives a false breakout signal.

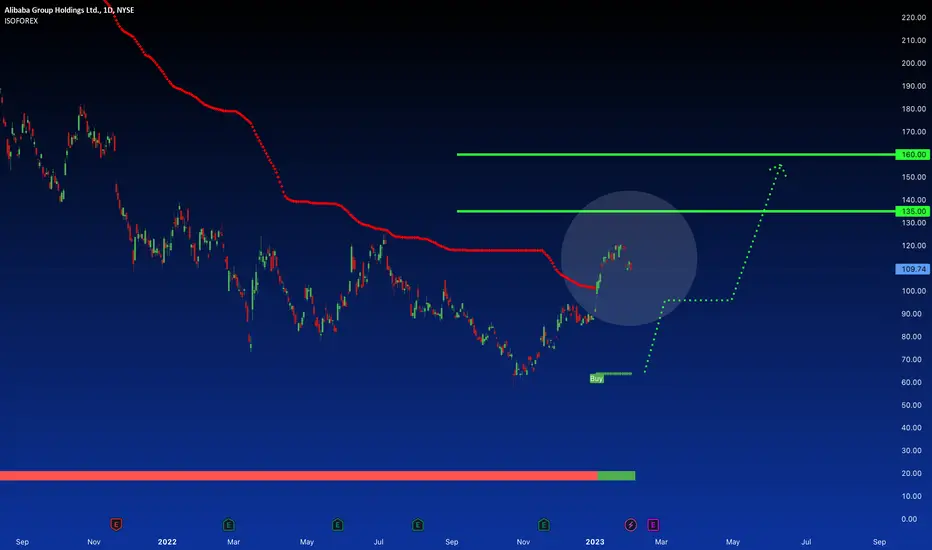
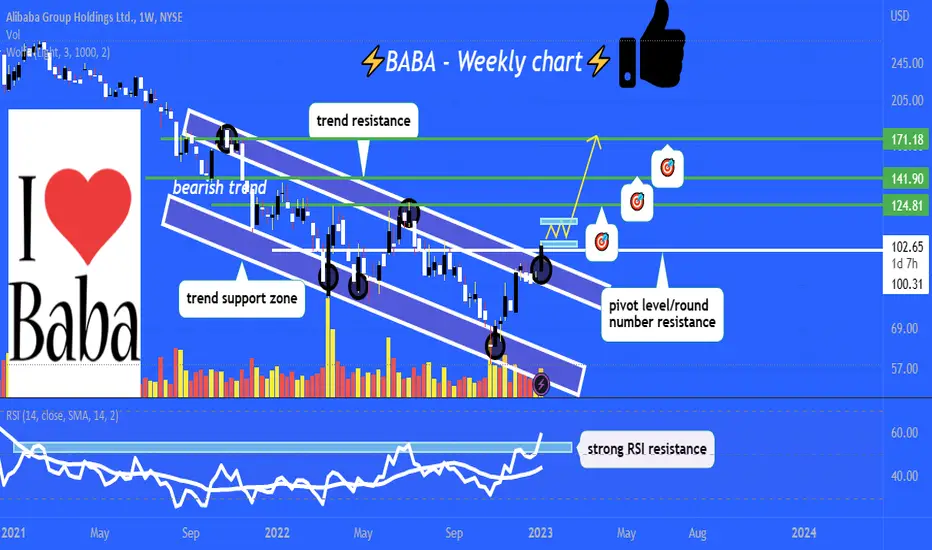
BABA breaks critical resistance 🔭watching for weekly candle break and hold above 100/trend resistance, consolidation then rally to 124-141-171 is likely if this happens.
lets see what happens, boost and follow for more 💙

IS ALIBABA REALLY UNDERVALUED STOCK?Billionaire Ryan Cohen is reported to have built a huge stake in Alibaba which worth hundreds of millions of dollars and now pushing for the share buybacks. Alibaba Group on the other hand had spent $18 billion repurchasing its own shares in the third quarter of 2022 and was aiming to buy back $40 billion worth of shares in total, with the plan lasting until May 2025.
With the recent investment in cloud computing the company is poised for strong growth in the future. PEG stands at 1.66 and ecommerce growth estimated $3 trillion by 2024, some analysts already suggesting better performance of the stock in near future. However, risk of growth lies with both local and international competitors including Amazon, Pinduodu & JD.
N.B!
- USOIL price might not follow drawn lines . Actual price movement may likely differ from the forecast.
- Let emotions and sentiments work for you
- ALWAYS Use Proper Risk Management In Your Trades
#alibaba
#baba

Little short and 1 month at bull waySmall drop of 8.5% in one/two weeks and then rise of 22% in three weeks.
