CBAUF trade ideas
CBA Pullback?It looks like CBA is about to pullback.
Evidence: Divergence in Weekly, Monthly candlestick pattern has long upper shadows, trendline break?

CBA.AX (CBA) ShortSome #ASX bellwethers are showing that the market is about to rollover. Take a look at the $XJO chart (interesting geometry) and the $CBA.AX and $MQG.AX charts. The $CBA chart in particular looks like an alarming short setup.

ASX:CBACommonwealth Bank, one of my safer stocks to watch.
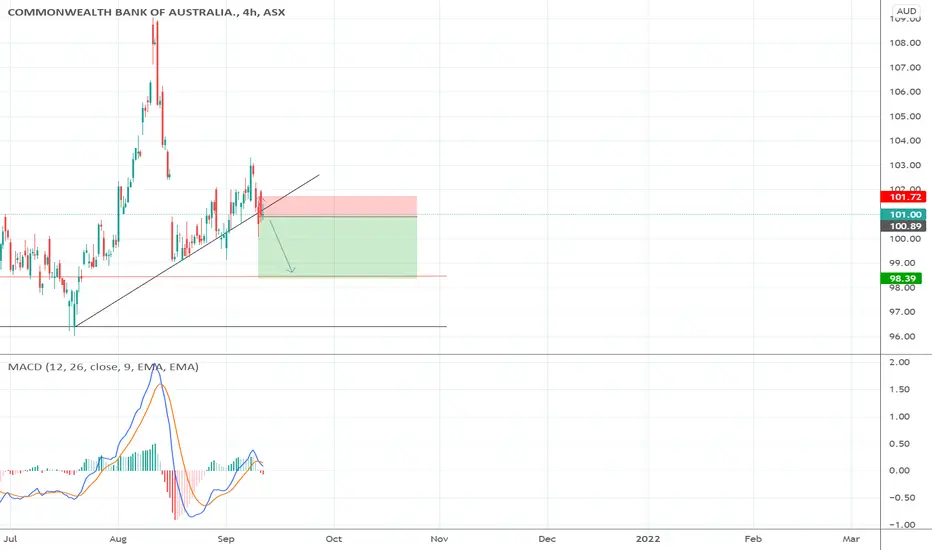
With an uptrend that felt like it would never end, we finally have a good buying opportunity on our hands.
Uptrend and downtrend are both coming to a squeeze on a support/resistance line.
Looking to buy in around the $98 support if price holds.
Otherwise letting it drop and hoping to get in at the $87 support line.
DYOR
I hope this helps someone

CBA short?CBA is waaaaayyyy over valued in terms of what an aussie bank would typically trade at on P/E and much higher than the other major aus banks. BUT where to try a short? I am thinking between 104 and 106.

CBA Long after breaking out on the upsideEntry: 100.56
Stop loss: 98.82
Went long in the counter after it broke out today amidst market optimism. Would have preferred a higher volume to go with the breakout though.

CBA GOOD SIGNAL BUYI am a consultant for anyone who needs a consultant, I see that CBA will GO UP IN THIS NEXT MONTHS
1, When you decide to use my ideas in your trading, please contact me to inform you of some things and monitor the position together without specifying a take profit or stop loss, we will decide when to open and close the position
2 (When I set the take profit and stop loss in a number that does not mean that the price will reach it, I gave a buy or sell signal only according to the analyzes I made in the chart and delete it later, in the order to share it with you so that you have a clear picture and read it clearly, thank you!)
3, you can try me for one or two weeks to decide to work with you and give you signals about buying or selling


COMMONWEALTH BANK OF AUSTRALIACOMMONWEALTH BANK OF AUSTRALIA
Our share of this era knows a very strong acceleration in its direction He will certainly touch the resistance line, and he will be wool back down Very strong for this I would recommend buying now to struggle for a huge abundance Big buyers and very strong liquidity as we are foggin Average price size

CBA Long after breaking out of baseEntry: 83.48
Stop loss: 81.84
Broke out of rounding pattern with above average volume.


CBA - retrace and up CBA should retrace towards Christmas and head up much higher after Christmas.
I am projecting a 6 days count from Dec 11 to the top of Dec 17, then another 6 days down to Dec 23.
Forecast, CBA will turn up on Dec 24.

CBA to test ATHReviewing the top A200 from each sector
CBA
Currently at weekly resistance, monthly looks very strong anticipate breaking out of falling wedge and attempting to print new high 92+
Wouldn't enter personally due to risk / reward ratio but can't fault the strength

Commonwealth Bank Long Setup After seeing the Banks in a major consolidation for almost 5 years now it seemed like an appropriate time to back them based on the long term bull channel with strong support levels.
No current material Take Profit in mind with discounted shares bought for long term dividend reinvestment plans being the goal for this one.
Based on where we are in the channel it probably is still a relatively discounted period if that next horizontal support does not cause a turn around.
Do your own research!
Happy Trading


Golden Cross on CBA EMA'sThe golden cross is a technical chart pattern indicating the potential for a major rally. The golden cross appears on a chart when a stock's short-term moving average crosses above its long-term moving average. The golden cross can be contrasted with a death cross indicating a bearish price movement


DAILY ANALYSIS commonwealth bank of australiaHi friends
the daily chart of this market shows with a high probability that it will experience a downtrend in the coming days but it is also better to be vigilant on the change of direction towards the reverse
please subscribe to receive more analyzes

waiting for $67.70 rangeIt's still in bearish trend, though on daily chart touching 200 days moving average.
It's one of the favourites and stable asset to hold, but overbought and overvalued.
I will probably wait for $67.00 to $68.00 range.
P.S: Please note these are my own notes for future reference and by no means trading advise to anyone. Please do your own research before entering into any trade.

let it settle down and trade come to you ~ $72.00I think I will be looking for entry at around $72.00 range.
also, it's important to note how it progresses after 12th Aug 2020.
I think there is still a lot of room to up - still my eyes are on the range of $78 - $80 range.
P.S: please note these are my own notes for future reference, by no means trading advise to anyone. please do your own research before entering into any trade.

Let's see what 12 Aug 2020 brings to us...graph and markings are pretty much self explanatory...
P.S: Not a trading advise, my own notes for learning and future reference.

sit tight & get ready to ride upi think currently market is trying to consolidate and soon it will resume up trend and bulls will take control of market, because:
1. price is continuously above 200 days moving average.
2. during last three weeks for 5 days price gone above 50 days moving average.
3. most of the volume is in the range of $70.80 - $72.20 range which is above 200 days moving average and pretty close to 50 days moving average.
4. based on last one year volume price comparison next targets should be:
4.1. $77.00 - $78.50 range
4.2. $78.50 - 80.00 range
I think we are not to far from upwars breakout.
if you like my ideas please give me thumbs up or leave comments. i think not may people are sharing their idea on this asset. i would really appreicate and incouraging if you consider donating some Tradingview coins.
P.S: These are my own notes for future refernce, by no means trading advise to anyone. please do your own research before entring into any trade.
