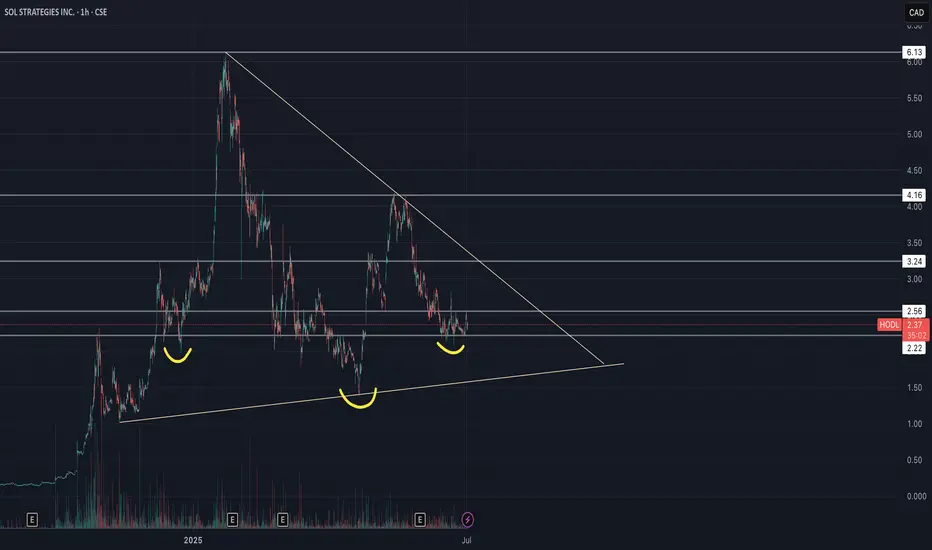
Sol Strategies Inc (HODL) - Inverse H&S🚀 SOL Strategies (HODL) – Public Market Gateway to Solana Yield
SOL Strategies (CSE: HODL) is a publicly traded company laser-focused on the Solana ecosystem. With nearly 395,000 SOL held (most of it staked) and over 3.7 million SOL delegated to their validators, they generate consistent income thr
Next report date
—
Report period
—
EPS estimate
—
Revenue estimate
—
0.0122 USD
4.88 M USD
7.06 M USD
121.63 M
About SOL STRATEGIES INC.
Sector
Industry
CEO
Leah Wald
Website
Headquarters
Toronto
Founded
2002
FIGI
BBG000BDW2S8
Sol Strategies, Inc. is an investment company. The firm is focused on the Solana ecosystem, which provides strategic investments and infrastructure solutions to enable decentralized finance. Its portfolio includes NGRAVE, Chia Network Inc., and zkSNACKS Limited. The company was founded on October 1, 2002 and is headquartered in Toronto, Canada.
Related stocks
HODL | Long Bias | Solana Correlation Play | (May 12, 2025)HODL | Long Bias | Solana Correlation Play (Like MicroStrategy for ETH) | (May 12, 2025)
1️⃣ Short Insight Summary:
HODL is a high-risk, high-beta equity that mirrors Solana’s performance, similar to how MicroStrategy mirrors Bitcoin. While fundamentals are thin and valuation is high, the technical

Long SOL Strategies at 2.64CADYou know what to do...
Enter a 1/3rd position immeditely.
Then DCA weekly around 2.64CAD/share.
(DCA remaining 2/3rds on meaningfull pullbacks or 50% retracements.)
Sell HODL when ETHEREUM hits new ATH in 2025. There may be a lot more upside, but better safe than sorry, IMO.
Cryptmando
Jan

SOL Strategies: The Next MSTR Sol Strategies Inc. (CSE: HODL) is a Toronto-based Canadian investment firm specializing in cryptocurrency and blockchain-related assets. The company’s primary focus is on treasury management through activities such as lending, staking, and liquidity provisioning. Additionally, Sol Strategies active

High Tight Flag: The Ultimate Key to Explosive ProfitsIn the realm of trading, there exists a chart pattern so powerful, so rare, that it feels like a prophecy for massive success – the High Tight Flag (HTF). This isn’t just another pattern; it’s the holy grail of bullish setups, a gateway to some of the most extraordinary gains the market has to offer

HODL on a little longer before buying more.... Just an idea of HODL's current pattern. It appears to be built on shaky foundation...still a bunch of noise about CHIA on the boards however the figures are so wildly entertaining it would be a 1 - mil long shot that Tony scored the deal the way people are talking.
Currently we are bleeding base

Cypherpunk Holdings / Bitcoin CADComparison of Cypherpunk Holdings and Bitcoin CAD. This chart shows the historical prices over the past years.

Is there any love left When the CEO starts acting like a turkey and BTC takes a nap...one trick pony's hit the glue factory.
I'm a holder of HODL and stupidly am still holding. Why? Who knows...Rule #1 is don't lose money...seems that I suck at rule #1 sometimes. Will BTC pump again? Who knows...maybe it has more gas,

HODL - A discount to just announced $10M institutional financingHODL sold off on news of $10M (at .34) financing and presents a nice discount at current levels. This is institutional financing and it is already spoken for / expected to close by March 24th. Gap at .375 is likely to close.

See all ideas
Summarizing what the indicators are suggesting.
Neutral
SellBuy
Strong sellStrong buy
Strong sellSellNeutralBuyStrong buy
Neutral
SellBuy
Strong sellStrong buy
Strong sellSellNeutralBuyStrong buy
Neutral
SellBuy
Strong sellStrong buy
Strong sellSellNeutralBuyStrong buy
An aggregate view of professional's ratings.
Neutral
SellBuy
Strong sellStrong buy
Strong sellSellNeutralBuyStrong buy
Neutral
SellBuy
Strong sellStrong buy
Strong sellSellNeutralBuyStrong buy
Neutral
SellBuy
Strong sellStrong buy
Strong sellSellNeutralBuyStrong buy
Displays a symbol's price movements over previous years to identify recurring trends.
Frequently Asked Questions
The current price of CYFRF is 0.8800 USD — it has decreased by −0.27% in the past 24 hours. Watch Sol Strategies, Inc. stock price performance more closely on the chart.
Depending on the exchange, the stock ticker may vary. For instance, on OTC exchange Sol Strategies, Inc. stocks are traded under the ticker CYFRF.
CYFRF stock has risen by 9.32% compared to the previous week, the month change is a −50.84% fall, over the last year Sol Strategies, Inc. has showed a 700.00% increase.
We've gathered analysts' opinions on Sol Strategies, Inc. future price: according to them, CYFRF price has a max estimate of 2.94 USD and a min estimate of 2.94 USD. Watch CYFRF chart and read a more detailed Sol Strategies, Inc. stock forecast: see what analysts think of Sol Strategies, Inc. and suggest that you do with its stocks.
CYFRF reached its all-time high on Apr 16, 2007 with the price of 4.6850 USD, and its all-time low was 0.0011 USD and was reached on Jun 29, 2020. View more price dynamics on CYFRF chart.
See other stocks reaching their highest and lowest prices.
See other stocks reaching their highest and lowest prices.
CYFRF stock is 17.00% volatile and has beta coefficient of 2.02. Track Sol Strategies, Inc. stock price on the chart and check out the list of the most volatile stocks — is Sol Strategies, Inc. there?
Today Sol Strategies, Inc. has the market capitalization of 145.00 M, it has increased by 0.23% over the last week.
Yes, you can track Sol Strategies, Inc. financials in yearly and quarterly reports right on TradingView.
Sol Strategies, Inc. is going to release the next earnings report on Sep 1, 2025. Keep track of upcoming events with our Earnings Calendar.
CYFRF net income for the last quarter is −3.35 M USD, while the quarter before that showed 2.24 M USD of net income which accounts for −249.54% change. Track more Sol Strategies, Inc. financial stats to get the full picture.
No, CYFRF doesn't pay any dividends to its shareholders. But don't worry, we've prepared a list of high-dividend stocks for you.
EBITDA measures a company's operating performance, its growth signifies an improvement in the efficiency of a company. Sol Strategies, Inc. EBITDA is 4.99 M USD, and current EBITDA margin is 84.99%. See more stats in Sol Strategies, Inc. financial statements.
Like other stocks, CYFRF shares are traded on stock exchanges, e.g. Nasdaq, Nyse, Euronext, and the easiest way to buy them is through an online stock broker. To do this, you need to open an account and follow a broker's procedures, then start trading. You can trade Sol Strategies, Inc. stock right from TradingView charts — choose your broker and connect to your account.
Investing in stocks requires a comprehensive research: you should carefully study all the available data, e.g. company's financials, related news, and its technical analysis. So Sol Strategies, Inc. technincal analysis shows the strong sell today, and its 1 week rating is sell. Since market conditions are prone to changes, it's worth looking a bit further into the future — according to the 1 month rating Sol Strategies, Inc. stock shows the neutral signal. See more of Sol Strategies, Inc. technicals for a more comprehensive analysis.
If you're still not sure, try looking for inspiration in our curated watchlists.
If you're still not sure, try looking for inspiration in our curated watchlists.