NKLA Stock Patterns Suggest a Bullish Bias LONGNKLA on the one hour chart shows several stock patterns which may suggest a trader to
sefely deploy a small portion of available risk captial here to have a good chance to make a
profit.
In the first instance, a "W" or " reverse cowgirl" pattern is seen as handrawn iin blue line. This
is bullish like the "M" pattern is bearish. The second pattern is an assymetrical head and
shoulders pattern with a rising to the right neckline suggesting a diagnonal rising resistance
over future time. Lastly a high tight flat pattern is seen with the flag of consolidation.
The flag pole is about 0.08 in height. Bullish continuation is forecasted by the pattern.
The RSI indicator shows the fast green line cycling up and down and holding in the lows above
50. All in all this is decidedly bullish. Fundamentally, NKLA burns cash and raises more diluting
its shareholders.
OF particular interest to this traders, call options for a strike of 0.50 for Fri Feb 16 went from
0.60 to 0.26 or 4.5X of the course of the day.
Stock shares or call options IMO NKLA is a buy - I am doubling my position and will watch it
on Friday using indicator alerts on the 15 minute chart. while my screen is showing other
action.
NKLAQ trade ideas

take on NKLAHYDROGEN could be the future of energy?
The prospect of hydrogen as a future energy source, especially for the automotive sector, has been gaining traction due to its potential for providing a clean and sustainable alternative to fossil fuels. Several automakers are poised to benefit from this shift, focusing on the development and commercialization of hydrogen fuel cell vehicles (FCVs). Here's a look at some key players in this space:
1. Toyota
2. Honda
3. Hyundai
4.BMW
and smaller startup like Nikola if they can survive with bad financial statement.

Nikola how low can it go?I think we have a nice double bottom with 30-50% possible down side and huge upside. It's a gamble, but I am stock gambler. I took a very small position. I like the chart and suspect this could under accumulation. Lots of analysts have much higher targets than here. Nikola sold off the Badger line to a close friend. Will this allow them more time to focus on electric / hydrogen trucks and gain edge again??? Not financial advice, DYOR.

NIKOLA Stock Chart Fibonacci Analysis 022624Trading Idea
1) Find a FIBO slingshot
2) Check FIBO 61.80% level
3) Entry Point > 0.78/61.80%
Chart time frame : B
A) 15 min(1W-3M)
B) 1 hr(3M-6M)
C) 4 hr(6M-1year)
D) 1 day(1-3years)
Stock progress : B
A) Keep rising over 61.80% resistance
B) 61.80% resistance
C) Hit the bottom
D) Hit the top
Stocks rise as they rise from support and fall from resistance. Our goal is to find a low support point and enter. It can be referred to as buying at the pullback point. The pullback point can be found with a Fibonacci extension of 61.80%. This is a step to find entry level. 1) Find a triangle (Fibonacci Speed Fan Line) that connects the high (resistance) and low (support) points of the stock in progress, where it is continuously expressed as a Slingshot, 2) and create a Fibonacci extension level for the first rising wave from the start point of slingshot pattern.
When the current price goes over 61.80% level , that can be a good entry point, especially if the SMA 100 and 200 curves are gathered together at 61.80%, it is a very good entry point.
As a great help, tradingview provide these Fibonacci speed fan lines and extension levels with ease. So if you use the Fibonacci fan line, the extension level, and the SMA 100/200 curve well, you can find an entry point for the stock market. At least you have to enter at this low point to avoid trading failure, and if you are skilled at entering this low point, with fibonacci6180 technique, your reading skill to chart will be greatly improved.
If you want to do day trading, please set the time frame to 5 minutes or 15 minutes, and you will see many of the low point of rising stocks.
If want to prefer long term range trading, you can set the time frame to 1 hr or 1 day.

$NKLA Bullish again Random Stock market cycle pic found some intresting candidate to buying position, this the stock which went all way to 92,5 usd dollar during Trever Milton BoOm , But 99% drop from all time high , But now they produktion started real fuel cell truks in the market we will see new wave upside available to those who love the Stocks please note that Stock are always long term senario investment unlike quick cfds , if your investing thing that you forget some thing upto one year or two Good luck

NKLA Nikola Corp Nikola Corporation Reports Earnings Results for the Full Year Ended December 31, 2023
February 22, 2024 at 09:01 am EST
Share
Nikola Corporation reported earnings results for the full year ended December 31, 2023. For the full year, the company reported revenue was USD 35.84 million compared to USD 49.73 million a year ago. Net loss was USD 966.28 million compared to USD 784.24 million a year ago.
Basic loss per share from continuing operations was USD 1.08 compared to USD 1.67 a year ago. Basic loss per share was USD 1.21 compared to USD 1.78 a year ago. Diluted loss per share was USD 1.21 compared to USD 1.78 a year ago.

Nikola Corp. NKLA - The bear is finally going into hibernationWe might have seen the worst of the bear market for NKLA. The strong downside movement is part of a long term correction wich in the Elliott Waves Theory coincides with the ABC pattern.
Wave C is almost complete and is forming a wedge pattern with its wave 5 < wave C. That means that the following movement should be a new impulse which could start with the breakout of the wedge.
In this scenario we implement the following strategy:
- Entry point: the breakout of the wedge;
- TP: $ 1.70; $ 1.98;
- SL: $ 0.62
It should be reached in very short term once the pattern is complete. We suggest to operate with trailing SL and TP in order to take advantage of potential stronger upside movement.

NKLAThis Week FORECAST
Opportunity for NKLA. This setup trading idea is for intraday. >> TAYOR
*If you want make long term investment, this counter very good to invest.
Risk Factors:
1. Market conditions, unexpected news, or external events could impact the trade.
2. Always use risk management strategies to protect your capital.

NKLA gets some momentum LONGNKLA had a nice long test run of one of its trucks in California this month. It signed a deal
for a 10-year hydrogen refueling. Not a big deal, but may be the first company to sell fuel
along with its vehicles and get government subsidies along the way. The days of doing photo
shoots of a prototype truck rolling downhill are clearly in the past. While alwys speculative,
NKLA is getting more search hits on Bezinga and Zacks suggesting there is trader interest and
maybe even some investors.
On the 120 minute chart, NKLA has ascended about 25% in the past week. It is approaching
the intermediate and longer-term anchored mean VWAP lines in black. It is there that volalility
and volume are expected to be the highest. This is 0.84 to 0.89. In this zone, institutional
traders may take or exit positions. The upper end of the high volume area is at 0.90.
I will take a trade here expecting price to go about 13% higher to 0.88. There it will either
continue the VWAP band breakout or be rejected from that resistance level. The RSI and MACD
indicators show bullish momentum to validate the long trade idea. An additional
factor is whether a short squeeze could ensue. In the near term from now until March, the put
to call ratio is 0.05 to 0.25 making for very few near-term put options. However, in the
April monthly the overall put-to-call ratio is 3.5. This suggests an expectation of a good rise
rise in the next 1-2 months and then a correction or breakdown at 3 months. In July the ratio
falls to 0.05 at least for the time being. If a short squeeze does get set up, put positions
in April will be liquidated in short order and the buying of call options to cover those puts
may accelerate the trend up.
Overall, my target is 0.88 while the stop loss is 0.73 under the evolving POC line of the volume
profile. Since my call options printed a 60% profit for the day, I will add to the position
to capture more of the expected move. ( $1.00 Strike 2/9 expiration currently $2.00 per
contract- no stop loss total loss vs expected gain 250%+)

NKLA#short term -it is making down widge
entry point 0.75$
target target 1.60 $ to 1.70 $
stop loss 0.55 $
#long term
Entry point 0.75
target 9 $
stop loss 0.48 $

NKLAIf you don't own any NKLA look at this. NKLA broke out from a 6+ month falling wedge. In my opinion NKLA is starting its sub wave 3 of grand wave 3 in Elliot's wave

Nikola Bullish momentum Weekly analysis stock pic found some intresting, Stock to buy now thanks me later after 6 months next you see 1 . Voucher incentive program from government and
many reason for clamate change


$NKLA load som for FreedomRandom stock pick my follower load some nikola bag because you need somthing to in portfolio to … strong buy candidte so also do your reasearch . Question for big bank account holders or Crpto aeunthestic does your account balance is in safe hand?. Do you own reasearch


Nikola (NASDAQ:NKLA) Posing Signs of a Bearish TrendInvestors are punishing Nikola (NASDAQ:NKLA) today, plunging the stock below $1 per share. A company announcement has investors losing confidence in the electric heavy-truck maker's chances for survival. The stock plummeted 23.5% in early trading before settling in with a decline of 17.6% as of 10:40 a.m. ET.
The drop is due to Nikola's latest announcement that it is seeking to raise more money through new offerings of both common stock and convertible senior notes. The company expects to raise $100 million through the stock sale and another $200 million from the sale of convertible bonds.
Technical Analysis
The 50-day moving average is acting as a resistance level, as NKLA has failed to break above it several times in the past few months. The 200-day moving average is also sloping downward, suggesting a long-term downtrend.
The 50-day Moving Average crosses the 200-day moving average moving beneath the 200 & 100- day moving averages respectively posing signs of a Bearish movement on Nikola Stock.
Based on these indicators, NKLA is showing a bearish trend with some bullish momentum.

nikola a bullish pattern target is above 2 just found intressanting stock for my followers
we are near to end of bear cycle 1st target is 1,5 tp2, 2.4

NKLA Update - 4 Hr Chart BullishPrice action is showing signs of consolidation, but still bullish. Price is expected to rush to 2.24, but I think it is going to trade sideways for a period of time. In the event of bad news there is the chance price goes to 76-78 cents as an extreme bottom. Until then I think price has shown support at 1.34 mark and trades sideways before rushing upwards to the 2.24 target and then we can explore additional action. In the event we break 1.34 to 1.27 and go downside then the 76-78 cents may become a reality. However due to the major harmonic to the far left- it is a bullish formation which is why I tend to think this also support bullish movement over time. So lets observe price holding in the green parallel trend and then following upwards in the orange parallel trend.
Consequently these are the exact same intermediate harmonics BTC is showing on the hourly- very strange, but BTC has already shown its breakout. Lets see if NKLA can do the same.

NKLA - 2 Different Long-Term WavecountsWe have 2 different primary counts on NKLA.
The first would have us assume that the recent downturn from $3.71 to $0.81 was all the downside we'll see. However, the structure for this move leaves no obvious evidence that it was the complete correction. Hence why I left a (2)? at the base of that move. If this is a full complete correction, 0.81 cents was the low, we'll never see lower.
The second wave count, has as assume that move first move down was merely leg A in a multi-month A-B-C correction, which would end in us seeing lows lower then $0.81, potentially even as low as $0.65.
Please note, I am truly unsure of which scenario could play out. Especially since institutions have been LOADING UP on NKLA over the past month.
Both Wave Counts Have The Same Next Move
Whether the first or second wave count, both have their next moves being set on the blue-line you see on-chart. With a swift move to test the $1.60-$1.70 range, followed by a pullback only to see $2+.
Comment if you have any questions or simply to appreciate my work :)
TL;DR
2 Different scenarios, both have the bluelines as likely to happen in the near-term, one has the redline to happen after.
ALSO: Please note we have bullish divergences on 6 different indicators on the daily chart. VERY likely we bottom here.

NKLA held by supportPrice is currently held on a support which is crossed by a trendline and 2 days ago we had failed breakdown of the trendline by the bears price needs to close above 1$-1.04 zone to be strongly bullish as for targets i have the previous highs after the price broke that level of resistance and as Stop loss recent swing low just below the support meanwhile weekly is forming bullish divergence on MACD

NKLA: Possible reaching $4.3 (+390%)My reading is:
1- Primary: it could be started the 3rd/ or C of Elliott wave
2- Seems it finished the wave 2 (correction)
Forecasting :
Conservatively: it may go to the upper bound of the channel $4.3(390%)
Unconservative: I will update when it break the upper channel
Confirmation of upward is breaking $1.43
The information is not meant to be, and do not constitute, financial, investment, trading, or other types of advice or recommendation.

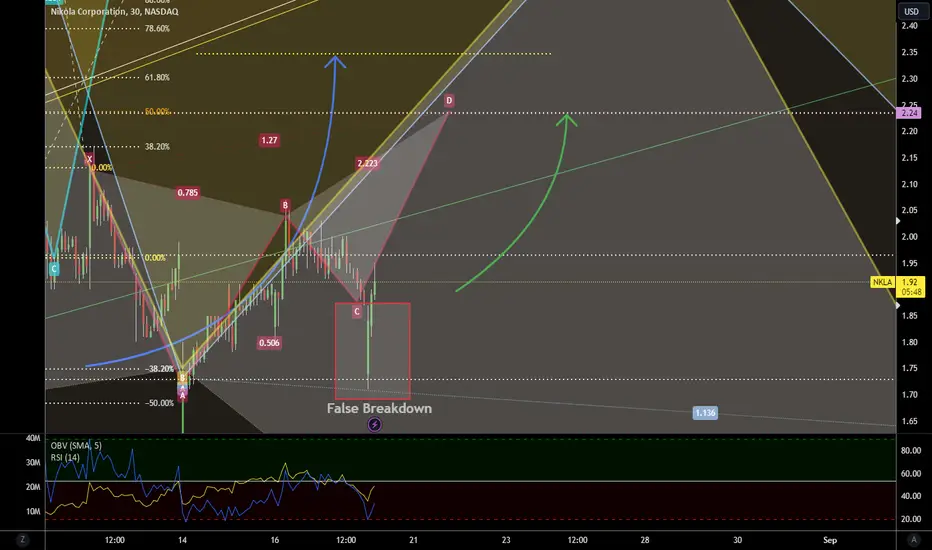
NKLA updateWell this is the updated chart. A few changes. The previous patterns played out and were removed, this is the new one. This is a minor crab pattern and per the previous chart the price points matched up perfectly (see notes). These patterns are notorious for the false breakdowns and long dips at the C wave (as seen here).
The previous target is blue arrow, the new intermediate target is green arrow. This 2.24 mark (when reached) is going to retrace, but not sure exactly how far. I think it will be minimal and carry up to 2.70 region, but I wont get ahead of myself just yet. The blue original target is in play, if this plays out as expected.. but time will tell. Much of what I am basing this extended run on is the Gann lines.
Short NKLA for obvious reasonsI'm making this post in retrospect, I'm shorting NKLA from 7.2.
As a chemist, I can guarantee you that they will fail in their intent, and cannot deliver things that are impossible. Even if they stretch themselves to deliver, the product will be a worthless piece of sh1t.
This could still drive the stock up, because degenerate "investors" could pump it up short term based on news, but the inevitable future of this company is just failure.
I intend to short it until it fails completely.
My leveraged position is structured of a regular 1:1 leverage and 5x leverage (my personal risk tolerance).
Don't be a complete degenerate, and calculate your personal risk tolerance. Also, don't put more than 10% of your portfolio on risky bets that could explode when cult followers make retarded moves. Nobody can survive that, no matter how right they are.
But in the end, I'm right.
