TCEHY trade ideas
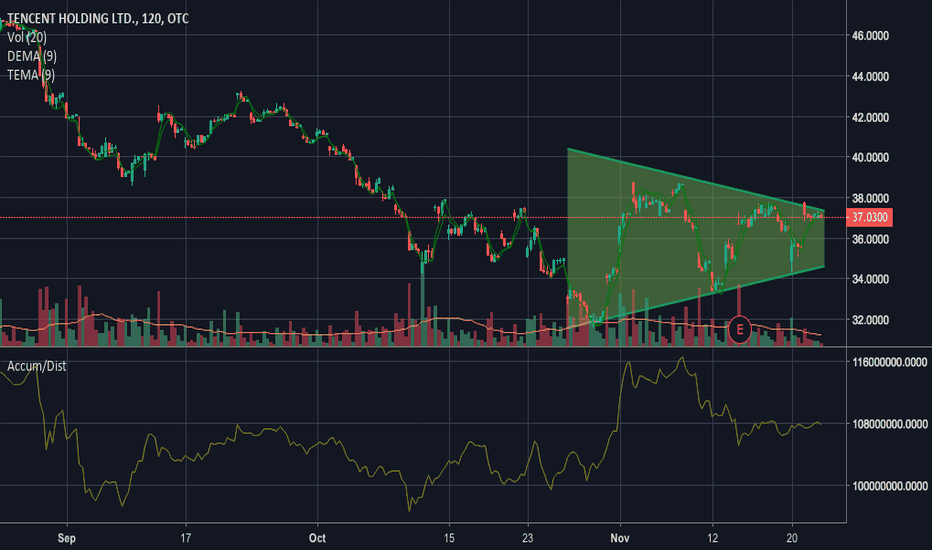
Victory Royale for Tencent?Tencent just invested 150 million dollars in Reddit, and keep in mind that Tencent owns 40% of Epic games... The creator of the video game giant, Fortnite. The Megalodon is giving us a buy signal on the technical side!
The Megalodon indicator uses an artificial intelligence, combined with data from over 500 buy setups, and over 2000 indicators to produce extremely accurate buy signals on any and all asset classes! Send me a message if you would like to try it for yourself!
Education: Tencent – Only Look to Long for The Time BeingLooking at Tencent’s Chart, it had broken out of an inverse head and shoulders formation pattern with relative ease. Price action is now hovering above both the 50 and 200EMA – a healthy signal that for the time being, its on an uptrend momentum. PA was also supported by strong buyers that emerged from its previous consolidation region during July 2017
A good support area will be at 310, while a big resistance region will be at 378.
Stay cautiously bullish.
Best Regards,
NourCapital - Tracking Smart Money Flow
Disclaimer:
The material (whether or not it states any opinions) is for educational purposes only, and does not take into account your personal circumstances or objectives. Nothing in this material is (or should be considered to be) financial, investment or other advice on which reliance should be placed. No opinion given in the material constitutes a recommendation by Nour Capital or the author that any particular investment, security, transaction or investment strategy is suitable for any specific person. You should be aware of all the risks associated with foreign exchange trading, and seek advice from an independent financial advisor if you have any doubts.
TENCENT700/1D, HKEX - SWING positionThe first pull back before H&S pattern on the 21st of sep' rebounded back down on the RSI 50 level (and 0.382 FIbo level) and went straight to the RSI oversold level to show the first shoulder on the graph. Then drew the head as the RSI was showing divergence. Candles went back up to 0.236 FIbo level (H&S neck level) before drawing the last shoulder. The last prices broke through two important levels :
- RSI 50
- H&S Neck level (0.236 Fibo)
You can also take a look at Ichimoku clouds. You will see a lot of bullish indications.
Buy the current price (a bit risky)
TP : 385 (0.618 Fibo)
SL: 280
Take a long position with a R/R ratio 3:1
or wait for the price to pass the 0.382 Fibo level.
TP: 385
Take a long position with a R/R ratio 2:1
700: Sort opportunityAn intraday high potential, Back Tested Sort Analysis.
We ll try to enter into the correction of the uptrend movement.
DETAILS ON THE CHART
NOTE: Entry range area above the entry point, is calculated upon 80% of the recorded pullback back tested past performances
DISCLAIMER: This is a technical analysis study, not an advice or recommendation to invest money on.
Tencent's Deep Correction Will End At $250 ??From a technical and Fibonacci angle, we should see a halt of the recent deep correction near $250 (i.e. 0.764% correction of the 2017's bull run started from $180 to $475). The 2018's correction was widely expected and from the previous historical data of the two big corrections of Tencent, a 40%-50% drop from all-time high should attract bargain hunters to accumulate this tech giant at a low level. My personal view is that the first wave of correction had already ended and we are expecting a bounce back to the huge gap left behind on the end of August ($343-$355). Let's see how Tecent can recover strongly from the abyss...
Tencent rebound before last fallIn my opinion we are currently in a wave 4 of the elliot wave theory, i'm expecting further downturn before see gains.
Also due to trade war possible downturn are still possible. In the long run however the company is solid and i think that further stock price increase is more than likely.
At the end on wave 5 will initiate long with this company.
TECENT: Where Will It Go?The TECENT declined nearly half of its market value from the beginning of this year. Many investors are anxious about its future.
Where will it go next?
Now there is an opportunity for traders to buy.
1. A good demand zone is at 260-270 levels.
2. The 2.618EXT of the leg in the top is at 272.
So it is good to buy at 260-270.
SL: below 260
TP1:333
TP2:400


