Trulieve LongPerfect set up on truelieve as we have our second bounce off the rib and a support zone. Targets are are normal, the fib extensions.
TCNNF trade ideas

We have seen this on beforeGood spot to put something to work. Alerts are going off today given the waves in the market. Clear out the noise and allow the charts to speak. Worthwhile thoughts here.
Edu. Only.

TCNNF - MSOs getting hammered$25 seems like a descent buy-in target.. Dems need to start making announcements on MJ reform otherwise these stocks will continue to tank.. GL
P.S. Ignoring the dip in March 2020 as it was a self induced sell-off

Trulieve - Valuation Matters - #MSOgangGreat company. There's lots of those. The monthly looks overheated for a while and $GNLN is #thegem.
#cannabisreform Ancillary company. Mega Merger with Kushco.
Small caps take the cake in rising rate environment. Sell those large caps!

Weed stock that will likely breakout to the up sideToday's TRUL has released earnings and has smashed the previous earnings indicating that they are executing very well.
REV, Ebitda, Net income ,Gross profits are all increasing .
They are steadily grabbing marketshare in the cannabis market , but strangely they are still in a downtrend. Fundamentally, I believe we have very good reason believe that investors will come to terms with this stock and start buying here. This is one knife I would not mind trying to catch as, or you can wait for the breakout, up to you.

Pull Back FishingTCNNF is trying to move. Large volume Bar with a pocket pivot noted a week or so ago.
Price is below the bands. Many consider this bearish but price is usually drawn to back the inside of the bands at some point.
Possible stop under 28.
Maybe the pot sector is ready to move.
RSI divergence at top but has been a while ago and would imagine it has corrected enough by now to have overcome that.
I have looked a few cannibis charts and this one is the one I see high negative volume on which can indicate big money interest.
Oversold on RSI .
The moving averages look awful and are not in order. Price is under the 50 DMA which is considered bearish to some. The 50 DMA is the orange line. The 200 is gently sloping up.
No recommendation.

TCNNF Rsi falling below 30Seems to me like Trulieve would be a smart play right now. The RSI hit the 30 threshold this morning which leads me to believe the company is undervalued. There could possibly be a Bollinger squeeze that's been happening the past few days. This is also leading me to believe the stock price will jump soon.

TCNNF Current Price $36 PT $50TCNNF | Shares (no options on this)
TCNNF Current Price $36 Price Target $50
This company is a US based weed producer and retailer. Trueville cannabis is one of the rarely profitable cannabis firms. They are set to benefit greater than any other stock on the market from more states legalizing marijuana because they are a pure play US pot company. Why buy Canadian pot companies ( TLRY,ACB,SNDL) that aren't profitable when the real weed market is in the US. For example the state of California alone is a larger market for cannabis sales than the entire country of Canada. Long term holder of TCNNF, Its my top pick of the pot sector.

TCNNFA motive could be established that DRASTICALLY changes the landscape, like legislative changes.......

TCNNF: Breakout Confirmed, 43.41% Potential Profit!Description: TCNNF is trending higher and in an uptrend meaning that highs are getting higher and lows are getting higher. The uptrend line on the chart and the Trending Band Indicator (which measures trend) supports the Long Position.
Stats:
1. Ideal buy range: $38.8 - $42.3
2. Take profit: $56.76
3. Stop Loss: $35.96
4. Risk To Reward: 1 / 5
5. Accuracy Rating: 98%

TCNNF LongTrade price: US37.45
TP: US52
SL: 34.39
R/B: 1 to 5
One of Wall Street's top MJ stocks where analysts sees 80% upside - Yahoo Finance (04/21/2021)
"Trulieve has a 50% share, roughly, of the Florida market and the market is actually accelerating,"

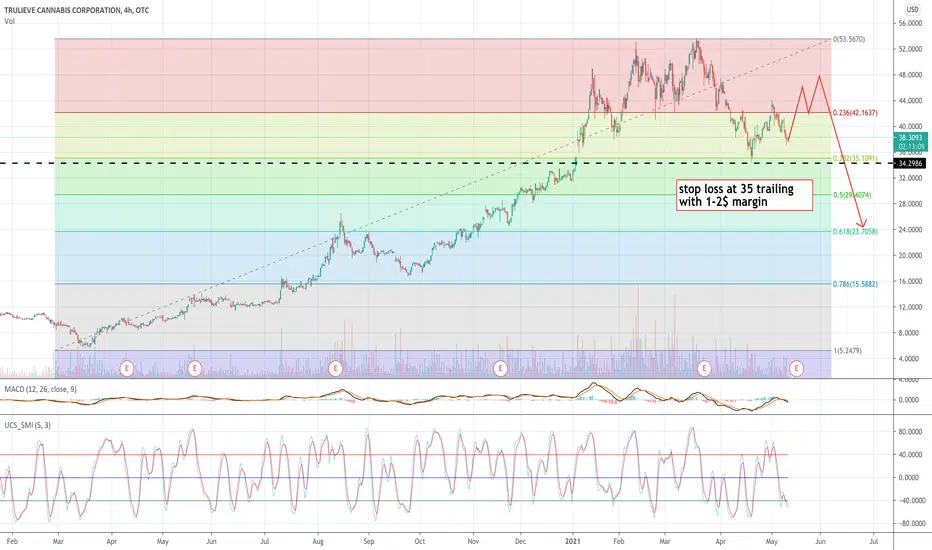
Pull Back FishingTCNNF was a possible parabolic arc. Also has a suspect top.
Most parabolic arc pattersn pull back 50 to 62%. Some more, sone less. TCNNF is struggling around the 0.5 fib level. If support holds, then possible triple bottom.
No recommendation. Just watching.


Trulieve Declines w/ Cannabis SectorTrulieve lost -$2.79(-5%) on the day with a closing price of $50.96/share. Price saw an 11% swing from high to low today(candle wick to candle wick) with price closing in the upper 50% of the day's trading range. Short-term support can be watched for at the $47.90 level which was the low for the day. A hold above that low is critical going into the end of the week, should that low be taken out price will likely see a further decline down to the $39.26 level which was where the last low in price was made prior to the rally to $60. This represents the last area of strong demand from traders meaning a hold above that level now would indicate that traders are still bullish on price above $40. The daily price candle also closed green which indicates that the short-term momentum behind price remains bullish.
The first lower indicator below the chart is the Price Percent Oscillator(PPO). This indicator is currently showing the green PPO line declining below the purple signal line which indicates short-term bearish momentum behind price. Both lines remain above the horizontal 0 level though which is the long-term momentum level to watch. Both lines above the 0 level indicate bullish momentum behind price in the intermediate-term while both lines below 0 indicate bearish momentum in the intermediate-term. The way to read the indicator right now is as it showing a short-term pullback inside of an overall uptrend in price, aka a ‘bullish pullback’.
The Average Directional Index(ADX) shows the purple directional line with a recent cross above the green directional line which indicates a short-term shift to bearish momentum from bullish. For the bearish trend to be considered strong, the histogram bars behind the would need to show a series of purple bars that progressively increase in size which for now only shows today’s recent crossover to bearish. A strong reversal to the upside in price tomorrow or Friday could easily flip this indicator bullish again, but for now the ADX is showing a shift to a bearish trend in price.
The Traders Dynamic Index(TDI) shows the yellow line((RSI(Relative Strength Index)) in a steep decline which indicates steady bearish momentum behind price. The yellow RSI line has also crossed below the lower blue line which is the lower Bollinger Band of the RSI. This represents price momentum making a 1.618+ standard deviation from the 20-day momentum average(center blue line) and is a bearish volatility indication. In general, you want to stay short or stay out of a stock when the yellow line is below the lower blue Bollinger Band line as the momentum and volatility favor the bears. The yellow RSI line is also testing the middle dot plots at the 50 level which is the center of the total RSI range(0-100). A yellow RSI line above 50 indicates bullish price momentum in the intermediate-term while an RSI reading below 50 indicates bearish price momentum in the intermediate-term. For now the move is to wait for the yellow RSI line to rise back above the lower Bollinger Band before considering this indicator bullish.
Overall, price is still looking good on a long-term basis with weakness in the short-term expected. From a trend trading perspective, a move above resistance at $60.91 is needed in order for price to gain traction in the uptrend, while a move below $39.26 would indicate that a new bear trend is likely forming in price. That $39.26 level is the most important to watch going forward if the decline in the cannabis sector continues.

Trulieve Bullish PullbackTrulieve lost -$2.79(-5%) on the day with a closing price of $50.96/share. Price saw an 11% swing from high to low today(candle wick to candle wick) with price closing in the upper 50% of the day's trading range. Short-term support can be watched for at the $47.90 level which was the low for the day. A hold above that low is critical going into the end of the week, should that low be taken out price will likely see a further decline down to the $39.26 level which was where the last low in price was made prior to the rally to $60. This represents the last area of strong demand from traders meaning a hold above that level now would indicate that traders are still bullish on price above $40. The daily price candle also closed green which indicates that the short-term momentum behind price remains bullish.
The first lower indicator below the chart is the Price Percent Oscillator(PPO). This indicator is currently showing the green PPO line declining below the purple signal line which indicates short-term bearish momentum behind price. Both lines remain above the horizontal 0 level though which is the long-term momentum level to watch. Both lines above the 0 level indicate bullish momentum behind price in the intermediate-term while both lines below 0 indicate bearish momentum in the intermediate-term. The way to read the indicator right now is as it showing a short-term pullback inside of an overall uptrend in price, aka a ‘bullish pullback’.
The Average Directional Index(ADX) shows the purple directional line with a recent cross above the green directional line which indicates a short-term shift to bearish momentum from bullish. For the bearish trend to be considered strong, the histogram bars behind the would need to show a series of purple bars that progressively increase in size which for now only shows today’s recent crossover to bearish. A strong reversal to the upside in price tomorrow or Friday could easily flip this indicator bullish again, but for now the ADX is showing a shift to a bearish trend in price.
The Traders Dynamic Index(TDI) shows the yellow line((RSI(Relative Strength Index)) in a steep decline which indicates steady bearish momentum behind price. The yellow RSI line has also crossed below the lower blue line which is the lower Bollinger Band of the RSI. This represents price momentum making a 1.618+ standard deviation from the 20-day momentum average(center blue line) and is a bearish volatility indication. In general, you want to stay short or stay out of a stock when the yellow line is below the lower blue Bollinger Band line as the momentum and volatility favor the bears. The yellow RSI line is also testing the middle dot plots at the 50 level which is the center of the total RSI range(0-100). A yellow RSI line above 50 indicates bullish price momentum in the intermediate-term while an RSI reading below 50 indicates bearish price momentum in the intermediate-term. For now the move is to wait for the yellow RSI line to rise back above the lower Bollinger Band before considering this indicator bullish.
Overall, price is still looking good on a long-term basis with weakness in the short-term expected. From a trend trading perspective, a move above resistance at $60.91 is needed in order for price to gain traction in the uptrend, while a move below $39.26 would indicate that a new bear trend is likely forming in price. That $39.26 level is the most important to watch going forward if the decline in the cannabis sector continues.

long position Very bullish structure. Upper break of the broadening wedge could make it parabolic high. RSI bearish divergence suggest a pullback is due.
My strategy is Add 15% at market price. And if breaks above wedge add 85%. Alternately if pullbacks deeper add buys fibbs level till .5. Blue ray lines are entry signals.
From Day trade perspective- Buy pre-market , Stop 1% and TP 8%
Welcome comments and suggestions.


$TCNNF Trulieve Cannabis Breakout Targets Trulieve Cannabis Corp. engages in the provision of medical cannabis products. The firm cultivates and produces its products in-house and distributes to its branded stores, as well as directly to patients via home delivery. Its products include smokable flower, inhalation, oral, sublingual, topical, inter-nasal, and concentrates. The company was founded on September 21, 2018 and is headquartered in Quincy, FL.


ABC BullishPot stock so not everyone's thing
I do like to own one and this is the one I chose
Short interest is very low
Not a recommendation
