xiaomi Hk1810Xiaomi need to take note if it break the previous high it will go higher as it prepared to break the current resistance
XIACY trade ideas

XI BUY OR LONG TARGET UP TO $17 PATTERN SHS XI has confirmed a good pattern "SHS" and a triangle pattern expected to surpass the highest peak of the year.
XI BUY : $13.20
TARGET : $17
STOP LOSS : $12.45
Wish you good deals!

50% upside more to go.........Around 10.64 was a good entry point after the fall in March this year as with all other equities.
It thrust forward very fiercely like a rocket launcher in 90 degree angles.
Now, it is retesting the resistance at 13.20 level. It may break out and continues to retest the next resistance at 13.56 to 13.94 level. Alternatively, it can conform to the Cup and Handle pattern with a nice correction to form the right handle (another way to view it is a bullish flag pattern) before charging higher.
Those who are late in catching this stock can wait for the pullback first.
Read some of its latest news here , here and here .


As shown in the chart12.1 is the key area of Xiaomi's price. This morning it retested this level and managed to rebound from 12.1. So, I think it's possible to see a big jump from the current area to 13.5ish. However, if the earning is trash, I won't be surprised to see this tank to 11.5 and might fall even further to around 10.

Big momentum in the near futurePredicted the rise in the last post. Back to the current situation, in the short term, Earning is the key. I am looking to get puts if xiaomi could hit 12.1 level. And will cash out if it could drop to 11.5 level. But, from that moment, it’s a big bet, which I would recommend purchase options. One for 13/12.5 call, and the other one for 10/9.5 put. Big swing is coming and I am watching this carefully.

As shown in the diagram Should test 12.1 during the earning season. If the earning beats, I think it’s possible for Xiaomi to hit 13.6 (13.3 for safer targets). Overall bullish, but I would not enter unless the price hits 11.2. SL 10.8.


Xiaomi's bullish is weak depite rebounding from the demand zone.Xiaomi sell-off will continue further based on the technical below:
1. On 17th March 2020, the report indicate that there is a further sell-off till the buying zone at 9.16-9.22 region and price did rebound at the zone. However, the bearish flag formation indicate that the buying pressure is more of a corrective action as the momentum is slowing down.
2. Zooming in to the price action within the flag, the stock is clearly engaging in a net sell-off as it had already formed a double top formation.
3. Candlestick price action suggest that the stock has two failed bullish pin bar, a sign of slow momentum and price broke out of the bearish flag on Wednesday close. This candlestick action can be interpreted as an evening star formation.
4. Stochastic oscillator shows a bearish crossover.


$1810 on a BreakdownProbably a good time to short sell Xiaomi as it breaks down from the symmetrical triangle in confluence with a break down as well on its 50-day SMA.


Xiaomi the chinas appleI personally love this company. They have a vision for future cheap good technology worlds 4th most popular phone and they are dope in smart home ideas. I see a great potential in this company for a long term buy 5-10 years holding this stock can give above great returns.


i bought the phone for its name , XIAOMIIn chinese, it means small grains of rice which we eat it from time to time for porridge (soft rice).
More than a handphone manufacturer, they are now aggressively expanding into AIoT.
The 4H chart shows it has break out of the bearish trend line and we are now awaiting for it to retrace to 9.48 before initiating a buy.

Xiaomi Moving into Mark Up PhaseXiaomi stock price jumped across the creek as the company announced the launched its low cost 5G phone today. Related Article
Today's action is different from previous rallies as price broke above a significant resistance level that we call The Creek, a resistance level within the accumulation set-up.
With this break out, we expect stock price to move into Mark Up phase where demand>Supply momentum is expected to continue.


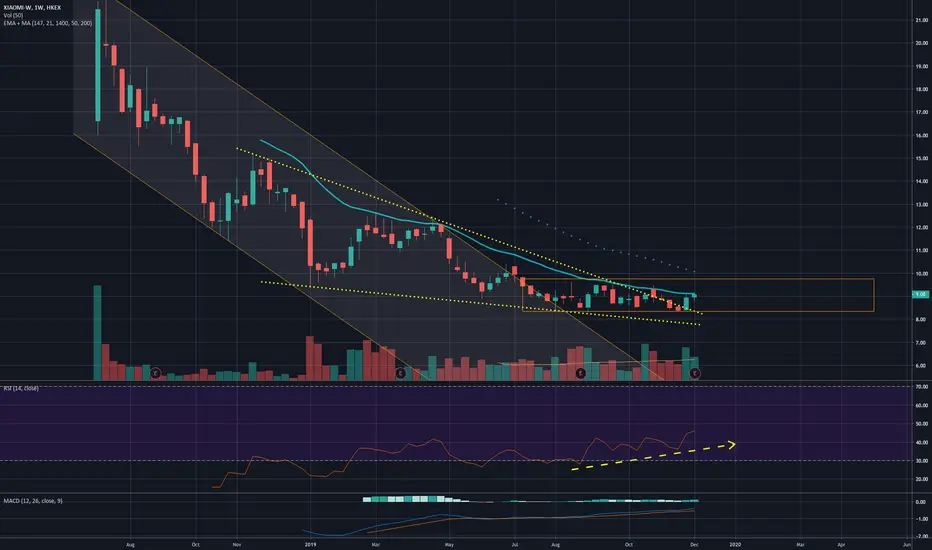
Xiaomi Accumulation phase? 4 Dec 2019Watch this stock closely. It has been ranging for 4 months with high volume. It has officially bottomed at September. Might run up soon.

$1810 Bottoming Out?$1810 - currently trading within the descending triangle with a potential double bottom pattern because of the support area at 8.30 to 8.40. Could be a good opportunity for those who will be entering a new position as the chart is showing me signs of a healthy bottom.For conservative traders, breakout from the descending triangle would be the best entry.
*Not a recommendation, just pure analysis.
