YZJ: given time, could the price surge to $3.59 to $4.10 ?Short-Term: Bullish, with resistance at \$3.20 and support at \$2.94.
Medium-Term: Sideways, with resistance at \$3.30 and support at \$2.85.
Long-Term: Bullish, with resistance at \$3.50 and support at \$2.75.
Next report date
—
Report period
—
EPS estimate
—
Revenue estimate
—
0.23 USD
901.70 M USD
3.61 B USD
2.66 B
About YZJ SHIPBLDG SGD
Sector
CEO
Le Tian Ren
Website
Headquarters
Jingjiang
Founded
1956
ISIN
SG1U76934819
FIGI
BBG000R7XK94
Yangzijiang Shipbuilding (Holdings) Ltd. engages in the provision of agency services for shipbuilding and related activities. Its products include commercial vessels such as containerships, oil tankers, bulk carriers, LNG vessels and other gas carriers. It operates through the following segments: Shipbuilding, Shipping, and Others. The Shipbuilding segment handles offshore marine equipment construction and ship design. The Shipping segment comprises of charter hire income earned by vessel owning companies. The Others segment includes ship demolition and vessel owning companies. The company was founded in 1956 and is headquartered in Jingjiang, China.
Related stocks

BS6.SGX_Bullish Breakout Trade_LongENTRY: 1.27
SL: 1.16
TP: 1.35
- ADX>25
- Daily RS +ve
- Daily FFI +ve
- Weekly RS +ve
- Weekly FFI +ve
- Moving averages are aligned.
- First breakout from range on 22 Sep 2022 with volume before retracement to resistance-turn-support area (1.03) and rebounded with volume on 6 Oct 2022.
- Breakout

BS6.SGX_Bullish Breakout Trade_LongENTRY: 1.03
SL: 0.97
TP: 1.09
- ADX>25
- Daily RS +ve
- Daily FFI +ve
- Weekly RS +ve
- Weekly FFI +ve
- Moving averages are aligned.
- Breakout from 52wks high today with volume .
- Entry today based on breakout.

YZJ - Breakout from SupportSign of Strength in the chart:
1. Bullish signal with volume
2. NS signal with Pullback
Disclaimer
This information only serves as reference information and does not constitute a buy or sell call. Conduct your own research and assessment before deciding to buy or sell any stock

BS6 Analysis (Long-Term) for SGX Stocks 1.40 to 2.50TICKER CODE: B56
Company Name: YANGZIJIANG SHIPBLDG HLDGS LTD
Industry: Industrials / Capital Goods / Machinery
Position Proposed: BUY
Technical Analysis
1. Pennant Pattern (Forming) The market should break out and retrace by the end of 2021
2. Fibonacci Retracement at 0.786 ( Silver Zone)
3. 1

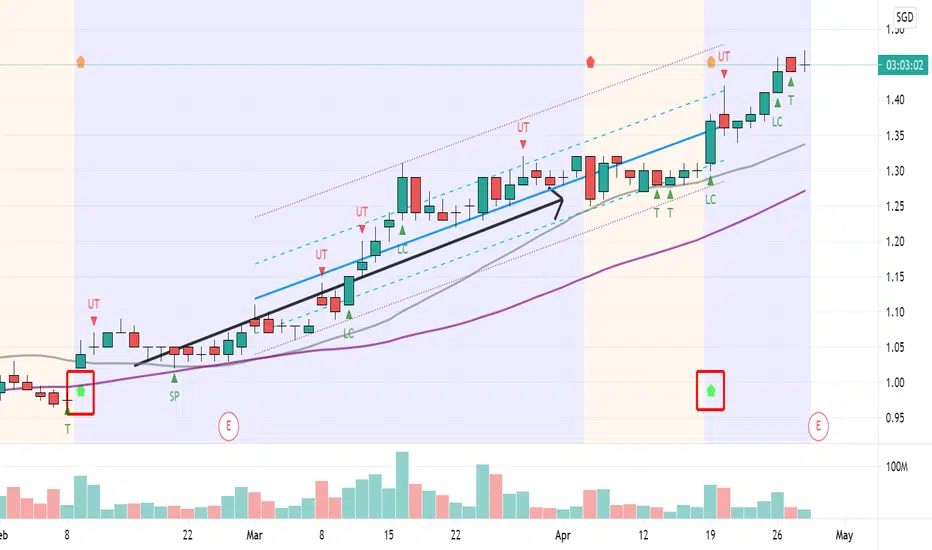
<TradeVSA> Continuation in Uptrend after PullbackSign of Strength in the chart:
1. Pullback Completed with Red Pentagon low volume & Green Pentagon high volume
2. Price moving with trendlines
Disclaimer
This information only serves as reference information and does not constitute a buy or sell call. Conduct your own research and assessment befor
BS6 (SGX) - Be Carefull for BearishGreetings
Humbled, we would like to thanks for your support who has already liked, commented and followed us. Your support, strengthens us, to help in analyzing the market. If you have any questions, do not be hesitant to send us message (inbox). Our Service : Signal recomendation, Trading Course, P

Something is brewing. Good to LongMid-Long Term trade
TP $1.16 (Revised along the way)
SL. $0.89
(Long term Investment can do dollar averaging)
If break down $0.70, must cut based on TA

YZJ Long1) Price reject MA200 on the 4hour chart
2) MACD bullish crossover from the oversold region
3) RSI attempt to breakout 50
4) Fundamentally, trading at attractive valuation
- Strong net cash of RMB 4.4 Bil (S$0.22 per shares)
- Annually dividend estimate 4.3% (annually in May)
- P/B 0.633
- P/E 7.6


See all ideas
Summarizing what the indicators are suggesting.
Neutral
SellBuy
Strong sellStrong buy
Strong sellSellNeutralBuyStrong buy
Neutral
SellBuy
Strong sellStrong buy
Strong sellSellNeutralBuyStrong buy
Neutral
SellBuy
Strong sellStrong buy
Strong sellSellNeutralBuyStrong buy
An aggregate view of professional's ratings.
Neutral
SellBuy
Strong sellStrong buy
Strong sellSellNeutralBuyStrong buy
Neutral
SellBuy
Strong sellStrong buy
Strong sellSellNeutralBuyStrong buy
Neutral
SellBuy
Strong sellStrong buy
Strong sellSellNeutralBuyStrong buy
Displays a symbol's price movements over previous years to identify recurring trends.
Frequently Asked Questions
The current price of YSHLF is 2.00 USD — it has increased by 14.29% in the past 24 hours. Watch Yangzijiang Shipbuilding Holdings, Ltd. stock price performance more closely on the chart.
Depending on the exchange, the stock ticker may vary. For instance, on OTC exchange Yangzijiang Shipbuilding Holdings, Ltd. stocks are traded under the ticker YSHLF.
YSHLF stock has risen by 14.29% compared to the previous week, the month change is a 15.88% rise, over the last year Yangzijiang Shipbuilding Holdings, Ltd. has showed a 21.21% increase.
We've gathered analysts' opinions on Yangzijiang Shipbuilding Holdings, Ltd. future price: according to them, YSHLF price has a max estimate of 2.97 USD and a min estimate of 1.25 USD. Watch YSHLF chart and read a more detailed Yangzijiang Shipbuilding Holdings, Ltd. stock forecast: see what analysts think of Yangzijiang Shipbuilding Holdings, Ltd. and suggest that you do with its stocks.
YSHLF reached its all-time high on Mar 28, 2008 with the price of 2.70 USD, and its all-time low was 0.14 USD and was reached on Oct 27, 2008. View more price dynamics on YSHLF chart.
See other stocks reaching their highest and lowest prices.
See other stocks reaching their highest and lowest prices.
YSHLF stock is 12.50% volatile and has beta coefficient of 1.33. Track Yangzijiang Shipbuilding Holdings, Ltd. stock price on the chart and check out the list of the most volatile stocks — is Yangzijiang Shipbuilding Holdings, Ltd. there?
Today Yangzijiang Shipbuilding Holdings, Ltd. has the market capitalization of 7.85 B, it has increased by 3.76% over the last week.
Yes, you can track Yangzijiang Shipbuilding Holdings, Ltd. financials in yearly and quarterly reports right on TradingView.
Yangzijiang Shipbuilding Holdings, Ltd. is going to release the next earnings report on Aug 8, 2025. Keep track of upcoming events with our Earnings Calendar.
YSHLF net income for the last half-year is 483.42 M USD, while the previous report showed 420.86 M USD of net income which accounts for 14.86% change. Track more Yangzijiang Shipbuilding Holdings, Ltd. financial stats to get the full picture.
Yes, YSHLF dividends are paid annually. The last dividend per share was 0.09 USD. As of today, Dividend Yield (TTM)% is 4.72%. Tracking Yangzijiang Shipbuilding Holdings, Ltd. dividends might help you take more informed decisions.
Yangzijiang Shipbuilding Holdings, Ltd. dividend yield was 4.01% in 2024, and payout ratio reached 38.49%. The year before the numbers were 4.36% and 33.03% correspondingly. See high-dividend stocks and find more opportunities for your portfolio.
EBITDA measures a company's operating performance, its growth signifies an improvement in the efficiency of a company. Yangzijiang Shipbuilding Holdings, Ltd. EBITDA is 1.01 B USD, and current EBITDA margin is 28.04%. See more stats in Yangzijiang Shipbuilding Holdings, Ltd. financial statements.
Like other stocks, YSHLF shares are traded on stock exchanges, e.g. Nasdaq, Nyse, Euronext, and the easiest way to buy them is through an online stock broker. To do this, you need to open an account and follow a broker's procedures, then start trading. You can trade Yangzijiang Shipbuilding Holdings, Ltd. stock right from TradingView charts — choose your broker and connect to your account.
Investing in stocks requires a comprehensive research: you should carefully study all the available data, e.g. company's financials, related news, and its technical analysis. So Yangzijiang Shipbuilding Holdings, Ltd. technincal analysis shows the strong buy rating today, and its 1 week rating is strong buy. Since market conditions are prone to changes, it's worth looking a bit further into the future — according to the 1 month rating Yangzijiang Shipbuilding Holdings, Ltd. stock shows the buy signal. See more of Yangzijiang Shipbuilding Holdings, Ltd. technicals for a more comprehensive analysis.
If you're still not sure, try looking for inspiration in our curated watchlists.
If you're still not sure, try looking for inspiration in our curated watchlists.