Altcoins Market Cap: We on the Verge of a 5T Exposion!Hey crypto traders! Let’s dive into this monthly chart of the Altcoins Market Cap. You won’t believe what’s brewing!
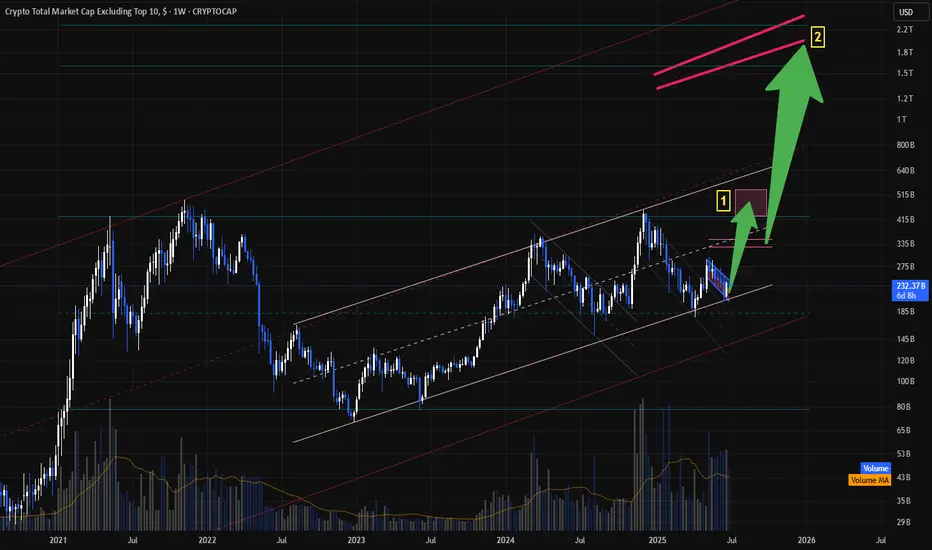
We’re currently approaching a critical channel support at 200B, a level that might act as a springboard for massive rally — check out the jumps from channel support in 2019 and 2023! Each time the market cap hit this support, it skyrocketed, and now we’re at that pivotal moment again.
The chart projects a jaw-dropping target of $5T within the next 24 months if history repeats itself!
The price action shows we’re testing the lower boundary of this ascending channel, with the market cap sitting around 239.65B. A bounce here could send altcoins on a parabolic run, potentially hitting 5T by mid-2026. But if support fails, we might see a dip toward 100B — let’s keep an eye out!
Key Levels to Watch:
Support: 175B (channel support)
Resistance: 1.55T, 5T (projected target)
Breakdown Risk: 100B
Are altcoins about to explode to 5T, or will we see a deeper correction? Drop your thoughts below!
PS take a look at others vs. btc price action here:
OTHERS trade ideas

$OTHERS: Decision Time for AltcoinsDecision Time for Altcoins
Unless something drastic changes — like Trump firing Powell and cutting rates to 0% — the chart suggests a potential correction.
MACD is overheated, RSI is overbought, and we're hitting major resistance. An ABCD or extended ABCDEF pattern seems likely, with a upside target around $260B amd a downside support at $230B in total altcoin market cap.
Of course, the market can always choose to ignore the signals and continue its uptrend directly to the next resistance at $260B.
Stay sharp. Let’s see how it unfolds.
DYOR.
#Altcoins #Crypto #Bitcoin #ETH #MACD #RSI #TechnicalAnalysis #CryptoMarket #DYOR #PriceAction

Next goalFrom a general view of the chart, we find, according to the analysis, that this rise is not a motive, but rather a correction, and this indicates that there is another strong decline coming soon unless it breaks the analysis failure area specified above.
*In principle, I am not a supporter of any direction, but I am only giving my point of view, which may be right or wrong. If the analysis helps you, then this is for you. If you do not like this analysis, there is no problem. Just ignore it. My goal is to spread the benefit. I am not one of the founders of the currency.

A Mini Rally and a Mega Rally expectation for Others MCapHi all,
This is how I follow Others Mcap.
If we break the ascending channel to the down, this idea will be invalid.
As long as the price keeps in the channel up, we should touch the upper channel band at some point which is Target #1 for me for a risk adjustment. I expect it to be in mid/late August. Then a small correction like 5-8 weeks. By beg. of October, I expect Others to start MEGA rally till end of the year.
These are just my opinions and not a financial advise.
DYOR!
Cheers!
OTHERS data points to biggest ALT-Season Good Day Investors and traders,
This the OTHERS on the weekly and I have taken some measured moves in what could be expected in time and price.
The OTHERS chart in my opinion is the last form of the higher risk curve which generally happens at the very end of cycles The others does not include the top ten crypto, so it a very good form of risk on.
I have been looking at the OTHERS chart fairly often of recent times because this is the time for it to really outshine Bitcoin and lead the market with fairly explosive gains.
I have marked a couple of possible time lines that could occur and both seem to be lining up in sort of way or another. From what I can see, others has one big wave remaining, and it’s the one you don’t want to miss
The Indicators
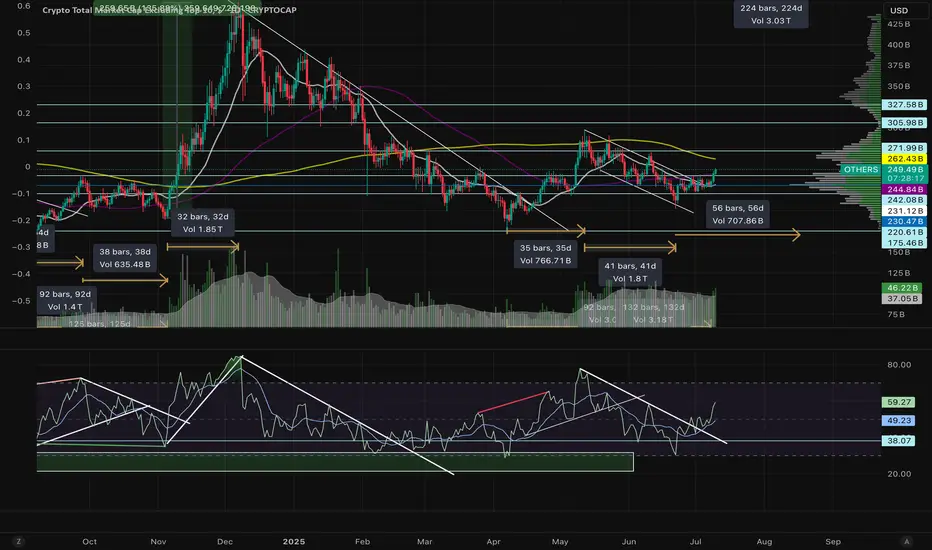
Fibonacci retracement
I have placed a potential take profit zone from the 1.272 to the 1.618 levels and anywhere in between. I have added an up trending channel that OTHERS would have to hold to stay somewhat relevant or then could be susceptible to adjustment.
2.RSI
I have measured the first breakout of the RSI from the 2015-17 and 2019-21 bull runs along with this one so far. The one more relevant to us is 2015-17 as this is the cycle we are more closely following. There seems to be a recurring trend of 90 plus bars before a top to OTHERS. One more thing that really stands out to me in the RSI this the first time it has shown a very strong bearish divergence. normally it seems to maintain or gain strength. right to the very end. time will reveal the real issue here.
3. ISO
The average sentiment oscillator to also show very consistent data for us. I have two measurements. The one points to late July and the the other late October. To me this could be the potential ALT-season time frame from July as it fizzles in the October time frame.
My suggestion to you is follow what you have been taught so far, do not get greedy, take profits when they are there and trust your game plan and stick to it. ALT- SEASON can you a lot of money, or lose you a lot of money. By design, its there to take any profits you have may have, or catch any late coming stragglers. Don’t get caught up in the hoopla.
Once again, I ask you for you input, I really want to hear from you.
Check my bio for more links and information
Kind regards,
WeAreSat0shi

I can’t be bullish here.The OTHERS chart shows a lot of similarities — I believe we’re still missing one more phase of disappointment, because after every bounce people keep shouting about falling dominance and an incoming altseason. Be careful here.
Others Up-Leg Maps w/ RSIMaps out lengths and segments of Others Up-legs w trends and divergences drawn on RSI
Altseason 2025 – Wave 3 in playIn this Elliott Wave setup, Wave 2 appears to be bottoming out now. As Bitcoin dominance shows signs of declining, capital rotation into altcoins could ignite the powerful Wave 3. Historically, Wave 3 is the most explosive phase, often driving sharp, sustained gains across the altcoin market.

Altcoin Season - Just around the corner!!!In this analysis I share my hypothesis on #OTHERS CRYPTOCAP:OTHERS as to why the big awaited alt season is right around the corner !
After analysing how the Trump mania season unfolded, I could see plenty of similarities:
1. Price filled the supply before the last retrace - gray rectangle
2. Then it broke the downtrend line and made a decent move up - red dot
3. Price correction to the 618 retrace on fib AND in the supply -> became demand from #1
4. RSI formed a hidden bullish divergence, marking a potential start of the rally
5. Time passed from #2 trendline breakout to the big impulse -> around 50 days
-> now we are around 60 days, which means more time to accumulate, bigger impulse
In an ideal scenario, the total OTHERS cap (all crypto excluding top 10) should at least reach the last high of 450 billions, and to pour some hopium, to around 600-700 billions...
So if you filled your bags around recent prices on your alts, you should expect at least 10-20x imo!

Is Alt season dead? - June 2025Let me start by saying, Youtube influencers are lying to you. The collective narrative (from those links shared with me) talk almost exclusively about the same set of narratives for triggering “alt season”:
M2 money supply. The printer will be turned on any minute.
The FED is going to cut rates, the market will then explode.
Institutions are buying the dip! “Blackrock fills Ethereum long positions” etc
A dollar collapse.
The real season begins in 2026, stack now!
It is the same rubbish time and time again. Rarely will one of those influencers << Look left << to tell you the News as it is written on the chart.
Let me tell you the News…
The highly anticipated "alt season," where alternative cryptocurrencies (alt coins) significantly outperform Bitcoin, faces considerable challenges to deliver the much awaited “alt season” where everything blows up. However I’ve long argued those days are behind us, we’re not going to see an “alt season” again, at least not in the sense many understand the term "alt season".
Alt season refers mainly to those tokens that reside outside the top ten crypto tokens. The total market cap of this cohort outside the top 10 is referred to as INDEX:OTHERS total, as is shown in the main chart. Now I’ve long argued corrections for Ethereum to $700 and below, Litecoin to $20 and lower, generally legacy tokens should perform the worst during this bull market, that outlook does not change.
Why so pessimistic?
Headline 1 - Support and resistance
It is that simple. look left. Each alt season closed a monthly candle above the monthly 7 SMA and monthly 10 SMA (Green areas) before getting underway. Not only has this not happened during this bull market, support from the rising channel has failed and if the current monthly candle closes as it (in 7 days), then past support shall confirm as resistance. This would mean a collapse back to the 2017 market top of circa $50 billion.
Headline 2 - Bitcoin halving
The truth is “alt season” began in May 2024, that is if you’re a believer in the halving cycles. If you’re a believer then you must accept this bull market comes to an end in 90 days.
The orange vertical lines represent each Bitcoin halving, occurring in August 2016, June 2020, and lately May 2024. The so called “alt season” would follow the halving for a 518 day period. There is only 90 days left for alt tokens to do their stuff before this cycle comes to an end. However, influencers only seem to talk about how great 2026 is going to be and how now is the time to start stacking. Instead 2025 is really going to create a whole new number of bag holders of dead projects.
Headline 3 - The number of circulating tokens
In January 2017 there was 8885 tokens, the good ole days.
June 2020, still only 19,500 tokens
Fast forward to June 2025 and we have 17.45 million tokens. Utterly ridiculous.
The sheer proliferation of alt coins, now numbering in the millions, creates an overwhelming supply that far outstrips demand. This fragmentation of liquidity means that even when some tokens see brief pumps, it's often selective with only a handful of projects having strong narratives or specific utility that truly thrive.
The simple truth is the market must kill off millions of those dud projects to free liquidity to the few that matter. If you really must know where the money is going to come from that causes growth in the remaining winners, it is from the realisation that a number of those projects are dead. That includes projects such as Ethereum and Litecoin. Both those charts share an important distinction no one wants to talk or hear about.
There are projects out there that’ll buck the trend, do you know which ones they are?
Not everything will collapse to zero.
Ww

$other are about to flyOthers are about to fly. They’re literally gonna melt faces if this charter is correct.

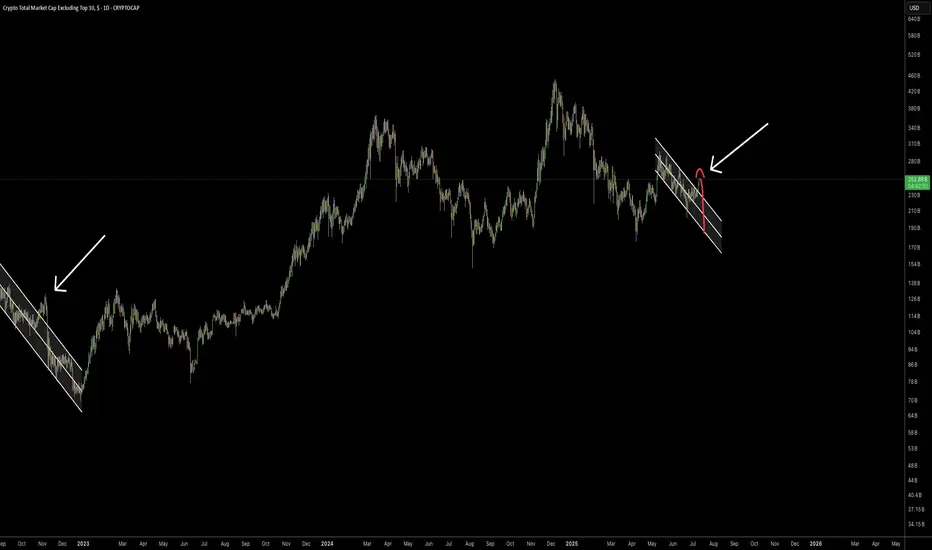
Altcoins: Warning. Check this chart!On the weekly timeframe, I’ve noticed a striking similarity between the 2021 cycle and the current one.
Take a close look at the chart—once you see it, you can’t unsee it.
Are we at the same point we were in March 2022?
The MACD is nearly identical
The RSI mirrors the same pattern
The Vortex Indicator stands at a critical crossroad
The only difference: trading volume is significantly higher
This setup resembles a potential triple top formation. If it confirms, it could completely contradict the bullish forecast I’ve held for months—or it might just be a fakeout.
We're at a decision point for altcoins: either the altseason kicks off in September and invalidates this bearish pattern, or we're headed toward a dot-com-style crash for most altcoins—excluding the top 10.
Keep a close watch on $OTHERS. History tends to repeat—let’s hope not this time.
DYOR
#Crypto #Altseason #BTC #CryptoAnalysis #MACD #RSI #BitcoinDominance #Altcoins #TradingView #TripleTop #CryptoCrash #Blockchain #CryptoCycle #MarketAnalysis

Simpel illustration of altcoin potential (30x)Connected some dots and we don't have to make it harder, the altcoin markets is picking up use cases and wit mature faster then we think, next FOMO will not only pull in corporate but the amount of people in crypto increases daily. I don't think anybody is ready for the next explosion.

Altcoins (Market Cap) - Excluding Top 10 Coins - Inverted H&SBullish setup on the daily chart. CRYPTOCAP:OTHERS have once again made a inverted head & shoulders pattern which is a bullish reversal pattern. With the yellow chart below showing the Global M2 Liquidity index breaking out aswell. With more money in circulation, the propabilty is that more money will enter the market over time. Although, there can be latency.
For now I will trust the patterns in the chart of Others and follow it to see IF we can confirm the Inverse H&S. We have to break the neckline which should be around 310-325 B for June and July. But still, after that we need a pullback to confirm that neckline and make it support for continueation.
It´s a very interesting world right now. And much can happen. But IF this break out. It would probably be one of the most explosive bull markets to remember for a long time.. I myself are holding quality coins and tokens. Im not in memecoins, whats so ever. With the adoption happening right now in crypto I don´t believe that is the right market to be in right now.
Nothing on this profile should be interpreted as financial advice. Always do your own research and investment decisions. Im only expressing my thoughts and beliefs. Nothing else. Crypto is a risky business but It also has a lot of reward If being right. I can´t find equal yield in any other markets for now. If you know any, plz comment below =)
BINANCE:BTCUSD
CRYPTOCAP:OTHERS
CRYPTOCAP:TOTAL
MARKETSCOM:ETHEREUM
BINANCE:SOLUSD
BINANCE:SUIUSD
ICEUS:DXY

The Charts Never Lie [Well, almost never]So many reasons to be Bullish on Alts right now.
Historically, BTC will peak first, and then ALTS will have their turn. It looks like they are prime for a run at least to the middle of the range, although why stop there?

>10 Altcoins Movement With the reduction in interest rates, we will have the start of the trend of altcoins and the start of the bull market.
Wishing you success.

You can't unsee itThere is something to be said for the simplicity.
The historical price action is clear.
The RSI trend/cycles are just as clear.
There is not much space left for compression.
A BIG MOVE IS COMING.
The only question is, are you ready?

Altcoin Cycle - Cycle bottoms spottedAs I demonstrated on this picture. I believe I identified the cycle bottoms and marking a new cycle low. With the BITSTAMP:BTCUSD price rising now and CRYPTOCAP:BTC.D about to meet hard resistance levels, I believe this will increase the propability of a start of the altcoin cycle. Also known as the Altcoin season.
CRYPTOCAP:OTHERS
CRYPTOCAP:OTHERS.D
COINBASE:ETHUSD
BINANCE:SOLUSD
INDEX:BTCUSD
BINANCE:BTCUSD

others - altcoins It looks like the altcoin season is about to begin and we will witness an alt party or alt season.

OTHERS | USIt held at 241B and will try to break 247B. If a 1-day candle closes above 247B, we can say that we are back. Our direction will be level 255B.
For this, volume needs to come from the US side and Asian stock markets need to support us in the coming days.

altcoins update The others chart have been very bullish since April The wave from the lows have formed perfect wave 1 completing 5 waves to the upside now the wave 2 which is typically 3 wave corrective is reaching it's end We can expect for the wave 3 in the coming days so alts will perform better

OTHERS Failed to break trendlineOTHERS failed to break trendline, seems like retesting before another dump ?

$TOTAL3 & $OTHERS - Bounce incoming within the next days/weekWe’ve now reached the full correction level on OTHERS and are getting ready for a U-turn.
Some downside is still possible, since TOTAL3 hasn’t yet tapped its trend reversal zone or target region — but that should play out in the coming days.
Scaling into my long swing position on many altcoins — ready to ride the next wave up!
