Altcoin Prediction: $1T Market Cap by Summer 2025 A few days ago, I posted my bold BTC prediction, which is much higher and quite different from the mainstream narrative on CT, forums, and some groups. Now, I'd like to share my Altcoin prediction as well, to demonstrate that I stand by it and to outline my goals as early as possible—not just a weeks beforehand.
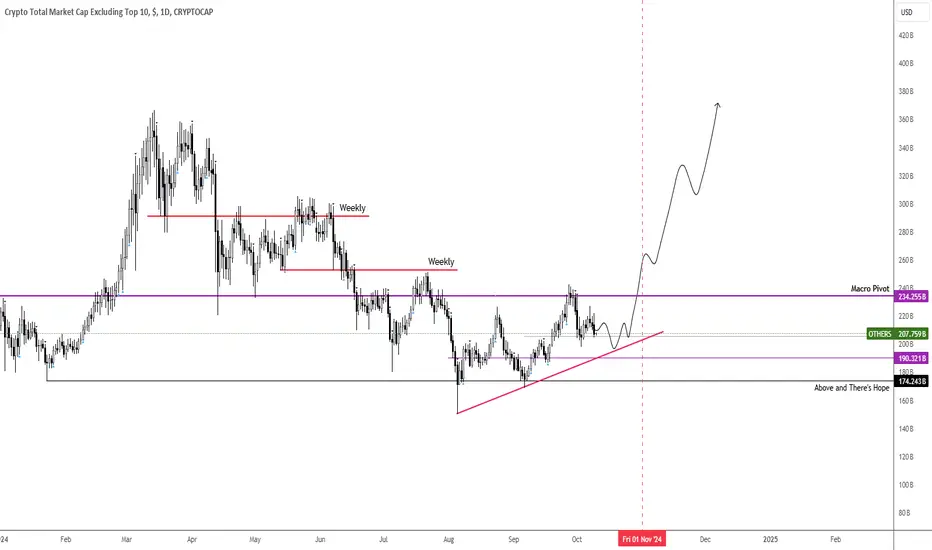
My prediction is that we are at late stages in a daily cycle today, which suggests a dip next week into December 4th, forming a low there, followed by a rally in December. This rally would gradually gain momentum, eventually topping in Q2–Q3, around summer, at a MIL:1T market cap in OTHERS / Total 10.
This aligns with the median line projection for summer 2025, confluence with the OTHERS/BTC upper band within a falling channel, and represents approximately a 230% increase, witch is calculated from others/btc. Additionally, this projection finds further confluence with Fibonacci levels derived from the March high, projected from the August low.
OTHERS trade ideas

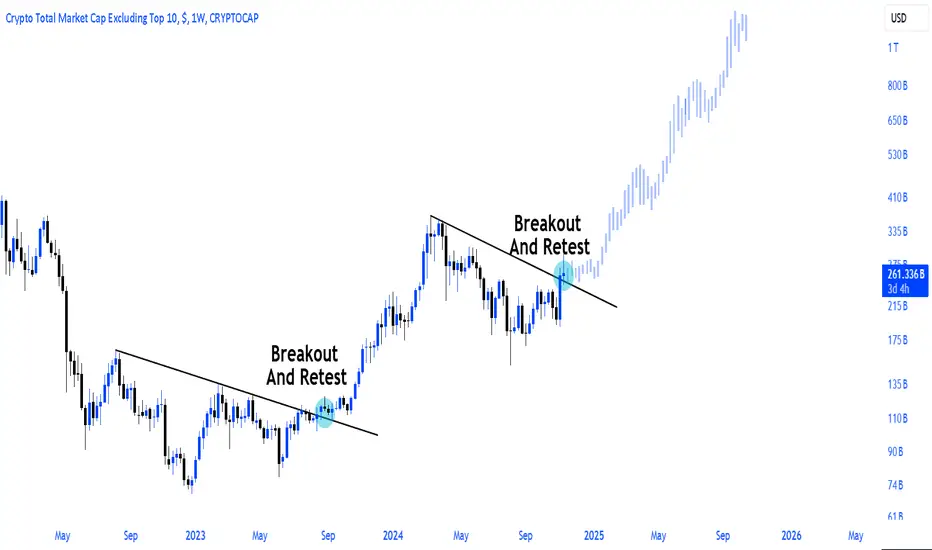
Alts about to go vertical CRYPTOCAP:OTHERS on the verge of a breakout into a potentially dizzying rallye.
Probably cut short tho some time around Q1 2025.
Still enough time to make it – LFG!

Total Market Cap Excluding Top 10The chart illustrates the Crypto Total Market Cap Excluding Top 10 (CRYPTOCAP) on a weekly timeframe, highlighting key patterns and potential market behavior:
Bullish Deliberation Block:
Two bullish deliberation blocks are marked (indicated by blue arrows), where the price consolidated after a strong upward move, showing indecision in sustaining bullish momentum.
These blocks often precede significant market reversals at higher levels.
Historical Pattern Suggesting Weakness:
Previous instances of similar bullish deliberation zones were followed by sharp declines, signaling that the current structure may repeat a historical bearish pattern.
The weakening buy interest aligns with a possible exhaustion of bullish momentum.
Third Wave Bearish Starting Point:
The chart suggests the potential onset of a 3rd bearish wave in a larger corrective structure.
This aligns with the marked decline zone, indicating a strategic sell point for traders anticipating a downward move.

AltsThose who know some thing about chart patterns would know what is being formed on the chart.
Alts are going to fly!!!!

ALTCOINS The alt season has officially begun.This is a clear technical representation of the altcoin market (total capitalization excluding top 10 coins) on the 1W timeframe that shows that we are on the 3rd week of the new alt season, which is the strongest rally of the Cycle. You can see all 3 Cycles so far and the common characteristics they share.
It all starts when the previous Bull Cycle peaks and the Bear Cycle starts, which is confirmed after the price crosses under the 1W MA100. Then a prolonged accumulation phase starts and when the 1W RSI bottoms it starts forming HL. A price crossing over the 1W MA100 again, coincides with an overbought 1W RSI, which confirms the start of the new Bull Cycle. After a Bitcoin's Halving, the alts market forms a Bull Flag and when the 1W RSI hits the HL and rebounds, the alt season starts.
The chart shows that we are on this stage at the moment. This is practically one of the very last opportunities you have to buy.
## If you like our free content follow our profile to get more daily ideas. ##
## Comments and likes are greatly appreciated. ##

Altseason Confirmation The CRYPTOCAP:OTHERS chart has broken the monthly downtrend that had been pushing capitalization lower for over three months. Recently, it retested this trend as you cans see in the chart, and today an uptrend confirmation has been identified.
I expect many altcoins will perfom an extreme pumps in the following days.
- BINANCE:BTCUSD price will continue to go up till 80k as first target.
- CRYPTOCAP:BTC.D BTC dominance will start to decline , allowing Altcoins to make the surge.
Happy selling !

Altcoins are about to run hard!Good day Traders-investors,
Today im looking at the others chart. This only altcoins lower than top ten and it excludes stable coins. I have provided three different time lines, The one week (Top left) the one month (top right) and the 2 week on the bottom. All of them are looking very bullish and are building to fairly substantial move over the next two months.
This also coincides with the timeline of the cycle (not included here) a big move is coming. According to the cycle (bitcoins cycle) bitcoin will run for approx 4 weeks, top out and then correct. The bounce of the correction will lead to altcoins top weeks after bitcoins.
The others first need to pass the area of 156 158 million as a first major resistance level. After that a run to 256 million is likely in fairly quick succession. If the others does happen to hit this level it will serve as major resistance and should top out there. I would most likely expect it to hit it than not to.
Indicators to look for..
On the weekly, the RSI has broken through the resistance levels and right now is retesting it as support, all good.
On the monthly, The RC1 3 lines has an all important cross with the red line. The ASO is about to have a across with the blue line crossing above the red line.
On the 2 week, the RSI is trying to push in the last resistance area, the rci3 lines have already had major movement are aligned for more growth and the ASO has had a cross and looks to be widening.
These are all very positive for the OTHERS.
please don't hesitate to ask any questions or add comments down below.
Kind regards
WeAreSat0shi

#Altcoins run hasn't even started yet!#Alts market cap #Others completes the right shoulder of the cup and handle formation on a weekly basis!
Epic moves that will turn into #altseason are inevitable!

Q4 Alts Market Outlook: Key Dates and Strategic OpportunitiesSomeone asked me for an update on the alts market, so here’s my Q4 outlook:
Total 10 broke out of the narrowing wedge a few days ago, and the previous resistance trend is now acting as support. From a cycle perspective, we have two important dates coming up: November 6 and November 9 (2-3 days before or and after window).
On October 6, several instruments—stocks and various cryptos— should hit their daily cycle low (DCL) on the same day. This event is significant and suggests we might see a decent flush with a price decrease around that timeframe.
My strategy is to have funds ready for the DCL October 6th and enter multiple long positions on my favorite alts, like Turbo, Ponke, and Popcat. However, any alts within the top 200 market cap should perform well. Another opportunity to add exposure will likely come around November 9, when we might see another flush or price decrease for BTC, and consequently, Total 10.
Remember to manage the risk, and remember that even if you see 10, 30, 80% bounce out of that DCL on your alts, they may roll over and decrease to lower levels than oct 6th eventually.

Others x Altcoins #Altcoins are in the early stages of a parabolic run!
#Alts market cap #Others is preparing for the mega rally phase seen in 2020-2021!
#Altseason gets closer every day!

OTHERS bull setupBased on patterns and impulses.
Choose your winners that will absorb this growth. NFA DYOR

Alt seasonIf marketcap crosses 280.127B in this weekly candle we have next level at 343.87B so might see a rally however might be short term given the stochrsi level. shoul comeback to retest this level given if 280.127B market cap is exceeded. be patient with your trade with altcoin till this candle is pinted

See my previous ideas if you have any doubts.Guess who's back?
I see altcoins and memecoins pushing up for the next 9 months or so.
Check my profile and decide if you wanna fade this.

#Altcoins Parabolic Run Loading!#Alts market cap After 240 days, the falling trend was broken and successfully retested!
#Altseason will be inevitable despite all disbelief!
Looking for altseason... This is an incredible chartThis is Others/BTC
Adding in my personal trading strategy, it seems to identify and give great entries into alt coins (all tokens 1 the top 10).
I have set an alert to state when alt season starts - but if we consolidate and hold this level - i think it starts in the next 40 days or so. If we break down obviously not, but we are currently sitting on a very strong pivot point going back to June 2017

OTHERS is getting ready for next impulsewell, as you can see i think the 202 level can be a key level for gaining momentum.
market has shaped abc for wave (4). so we can possibly consider a wave (5) at least to the height of wave (3).
it is a good opportunity for adding high potential ALTS .
#DYOR

Don't F@ck up the Banana zone!This is the Others marketcap vs the Bitcoin Market cap chart.
With their respective Banana zones for the past couple cycle and the current one we have already started.
The KEY takeaway is you should be feeling the FOMO and kind already have been deployed into your favourite #Alts
This #altseason may yield one of the worst performances in a cycle --- which I have warned a few times now. And finish sooner than you think.
If you had waited for confirmation of a altcoin breakout and rotated/bough at the sad face this how your returns would have been crippled.
21 X ----> 5.8X 2017
6.4X ----> 3X 2021
3/4X -----> 1.75X/2.3X 2025
Drastically different.
I hope you have found this chart informative. Smash the likes.

OTHERS in Wyckoff ReaccumulationAs per the title, I believe that OTHERS is in Wyckoff Reaccumulation.

The real excitement The real excitement starts when this trend line breaks. Until then, the higher CRYPTOCAP:BTC climbs, the more funds will be available for rotation.

#Altcoins mega bull pump is almost there!#Alts trends Depin Rwa L2 L1 Memecoin AI gaming Defi and many other topics will be pumped.

Altcoin will "mini" rug in early of NovemberPrice is heading the support level and no news with gain momentum
War in Israel is still going and when triggered about war news Alt will bleeding
Altseason is inevitable“Q4 2024 is the beginning, 2025 is when #altcoins will enter a parabolic awakening, those who are patient will rule the future.”
#Alts will create new millionaires in 2025!

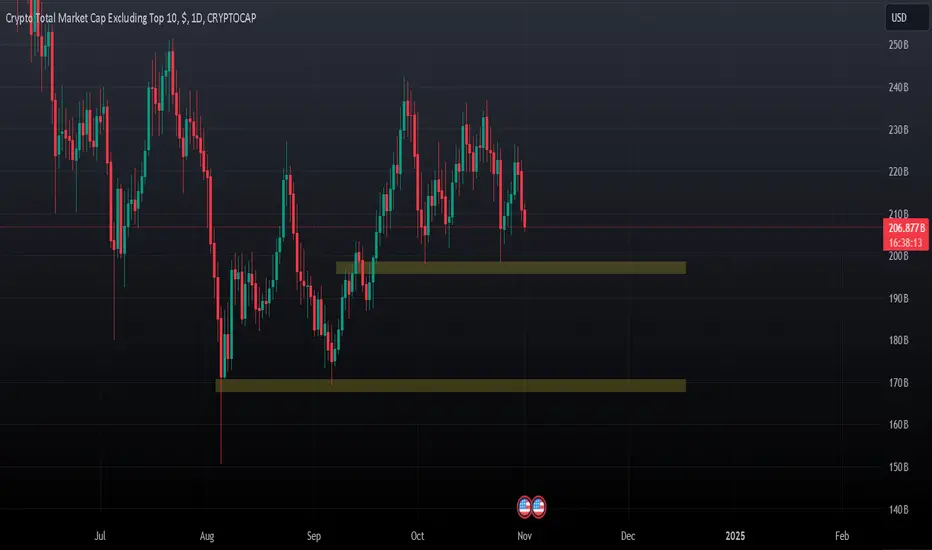
Altcoins - Basing in October: Will November Bring the Big Move?It seems we’re still in a basing or rotating cycle. We’re close to a trendy move, regardless of whether it’s bullish or not, as we near the end of this consolidation phase.
October has turned out to be #Flatober instead of #Uptober. That’s alright; the tighter the consolidation, the greater the chance November will make a definitive move in any direction.
I still lean bullish, but this week’s daily price action is a bit worrisome. Crypto appears to be used as a hedge, while equities remain the predominant risk-on asset going into CPI, making new highs as crypto retraces back to last week’s initial levels.
Basing for #October > Moving on to #November.