OXT USD at Risk of Falling to Around $0.44 in the Near TermThe use of the Phoenix Ascending indicators and the Bad Ass Bollinger Bands in the near term group of time frames (1D, 2D, 3D, 4D), which act as a compass, in conjunction with the short term group of time frames (90 min, 3H, 6H, 12H), which allow for more precise entry and exit, to provide a technical analysis for OXT USD. It appears likely that we will see some upward price action for OXT USD in the short term group of time frames (90 min, 3H, 6H, 12H) yet OXT USD is at risk of falling in proximity to the Bollinger Band basis in the near term group of time frames (1D, 2D, 3D, 4D). Please note that the Phoenix Ascending indicators and Bad Ass Bollinger Bands have been made publicly available by David Ward (@WykoffMode). I highly recommend watching David Ward's video publication to educate yourself on how to properly interpret these indicators (www.tradingview.com).
Note: This is not financial advice. I am not your financial advisor. These are my opinions.
OXTUSD trade ideas

OXT Won't Be Knocked OutOverview
- BTC dropping had an effect on OXT, but this drop may have kept OXT on track to making new ATH. Let's start from the top!
Price Chart
- This time on the chart you can see the activity we had before making new ATH and the activity we have now.
- 50 EMA(yellow) acted as a perfect support for OXT when it was dropping. If BTC decides to continue selling off, it's possible that the 50 EMA support gets broken
- You'll have to zoom in on this but we are back into the bullish channel! You'll also see a bullish hammer candle that will be confirmed if the next candle closes green
- If BTC continues to sell off, I see we could drop down to the $0.44 then $0.37 area
RSI
- The main reason I spread out the chart this time is because of the pattern we made in the RSI prior to reaching ATH. What I did was trace the trend and mirror it to where we are now and we are surprisingly similar
- If we were to replicate the same trend, odds are we would be seeing a new ATH in less than a month
- That trend was an inverse head-and-shoulders and it appears we may be halfway to forming another inverse head-and-shoulders
If you enjoyed this analysis or learned something new, please like this idea so more people can be aware of the possibilities of this coin.👍
Feel free to follow for for important updates for this coin and trading strategies.🏆
Would also like to know your thoughts! Remember this is not financial advice , however, it is an overview of what I am seeing in this coin's price action.
-Happy Trading
MoneyGrind

OXT ready to take offOXT just did a nice 50% retracement after a 275% rally over the past couple of weeks. Correction was needed to reset the RSI on the daily and totally in line with the rest of the crypto market. Now we got room to go to 1.15USD over the next couple of days/weeks. I expect some FOMO in advance to the ORCHID event at the end of march where E. Snowden is one of the main guests. OXT has a solid team and project. Listed on all major exchanges. Not yet in the top 100 market cap crypto's and still not reached its ATH so hop in now, 1$ will be there soon!!

Another possibility for OXT #KBTradesWe may run across the bottom of the iso triangle support line for a bit with increasing lows and increasing highs but a 10-15% incline for about a week until you see the lows well above the bottom iso triangle supports. That means the bulls now control the market. Look for a bump to .68 then.

OXT headed NORTH | 40% GAINS | AS GOOD AS A BREAKOUTSuccessfully identified the same pattern forming as a few days ago where the iso triangle has a support bounce followed by a small rally and a 10-12% decrease. (Pink circles) If the pattern continues the chart will follow the yellow arrow north at an incline of 87%. Still good for a 40% jump in the next 24-48 hours. Target sell price .69-.73 depending on how lucky you feel...

Next bounce up at 48.03See traced lines. 12.5% is the first significant drop after the bounce. Set a limit buy at 48.10 and enjoy.

OXT SUPPORT PATTERNOXT seems to bounce off the bottom support lines and then immediately zig zag up to the resistance line. I've highlighted some very similar patterns after coming in contact with the support line.

OXT is a STILL A STRONG BUY. Make 30%The bounce held true to the bottom of the triangle. Crypto is going a bit crazy right now but prices are okay again. OXT should be around .70 in the next 72 hours.

OXT is a STRONG BUY. OXT chart is not an ALT tied to BTC and ETH like other ALTS. Seems to follow Technical Indicators well. Stayed inside symmetrical triangle, seems to be headed north to .69-.73

OXT next stops base purely off of statistics
* Based purely on my statistical calculations (my profession)
I calculated the correlation between BTC and OXT and past corrections. Based on that our next stop is .41 then .54 then .50 then .59
We shall see! This is not financial advice, just a nut doodling calculations.

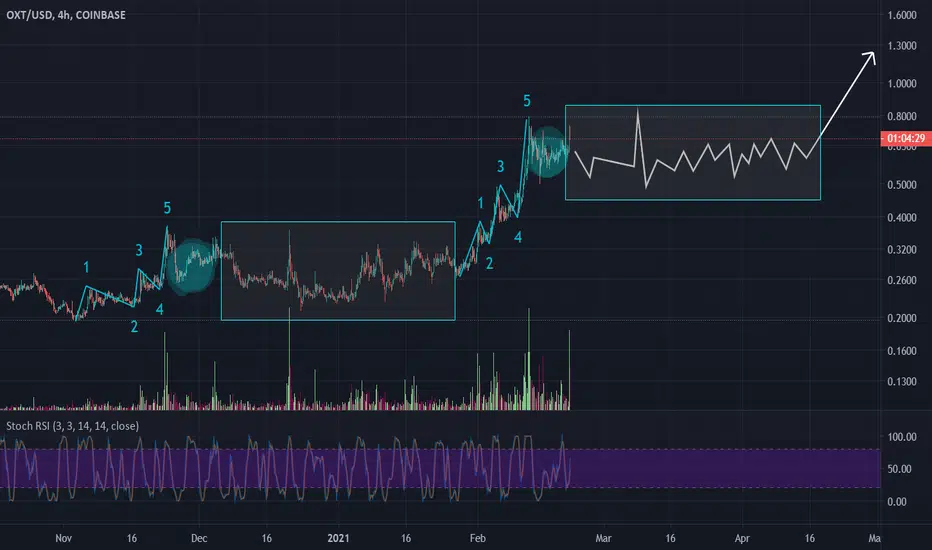
OXT Could Be Preparing For Round #2Overview
- Spent a TON of time trying to get this chart all formatted with as much information as I could for you guys so hope you enjoy. Long-term still bullish on OXT and I recommend following along with the idea description to make things more clear(unless you're an adventurous type) Let's start from the top!
Price Chart
- Let's start before the breakouts even occurred. At this time, OXT was in a channel and at the end of the breakouts, prices rose 119% from the top of the channel
- Now we could be in another channel for some time if the symmetrical triangle pattern does not play out. If another breakout occurs and rises by the same %, we can predict to reach $1.62 to be the close of the candle(could go higher)
- 20 EMA acted as a support, let's hope it continues
- Even if we fall outside the symmetrical triangle pattern, we are still bullish because instead we may just be in a channel
RSI
- Here's where things get interesting. To start, drew two ascending channels(green) inside a curve(yellow)
- We can see that before the breakouts started to occur, the RSI dropped down to touch the secondary line. Could we be doing that again now?
- Also notice we have an ascending trend when the RSI tries to touch the secondary line
- Used a curve because I wanted to see if it had any impact on a future breakout if it occurs
Stoch
- Also great stuff here. To start, drew two descending trends and a dashed line that represents the two lows
- Notice that the descending trends start just a little after the ascending trends in the RSI on both sides
- The "W" structure in the middle also looks fairly similar to the "W" structure that occurred before the breakouts with a sharp rise, drop, rise, and drop
Additional
- Don't have much info about this chart showing a double bottom or double top as both seem possible
If you enjoyed this analysis or learned something new, please like this idea so more people can be aware of the possibilities of this coin.👍
Feel free to follow for for important updates for this coin and trading strategies.🏆
Would also like to know your thoughts! Remember this is not financial advice , however, it is an overview of what I am seeing in this coin's price action.
-Happy Trading,
MoneyGrind

Bullish on OXT: Short term opportunity for 40% GAINS to .69Larger symmetrical triangle forming, OXT is still a great buy at .48 and should have a nice bounce up to .69 in the next 7 days. Larger bounce should take us to $1 - $1.25 range by mid-April.
'The above references an opinion and is for information purposes only. It is not intended to be investment advice. Seek a duly licensed professional for investment advice.'

Bearish outlook on OXTUSDIf no daily close above Monday high, we should see repricing to the 50 cent range.

OXT I'll be optimistic if the daily close is above .6150
If you accumulated, CONGRATS! If not, don't worry it's just another day in crypto. (I sold @ .67 and was waiting for a better entry, I had .5050 buy order...but I got impatient and reentered @ .60. Gotta stop doing that!)
Obviously, all coins were affected today. If we have a daily close above .6150 and BTC stays around 57K we should still be on track to our previous predictions. If not, it's back to the drawing boards. We might be in for some 40's and possibly 30's in the near future.
I'm extremely good at predicting the corrections and crashes (way more than the booms and moons) so ill be sure to update on here as soon the crystal ball defoggs a bit.
Not financial advice, just my la di da opinion.

Oxt tea anyone??Formed a beautiful rounded bottom currently forming handle side ways price action and up we go arrow pointed left is old ath 1.00 other alts currently creating new highs when oxt haven't touched ath why not be bullish?? This is pure speculation and not financial advice 😁☕🚀

continuation bet on OXTbreakout trade on the backtest targeting the measured move, then alltime highs i believe?

$OXT to $1.00? 4HR TF IdeaCOINBASE:OXTUSD to $1.00? 40% gains await us if so! The ride might be a choppy one if patterns continue. Let's see...
Massive C&H OXT Daily! Send it!Send it! a Close above the neckline will bring us to 1.20 Price target

OXT - Pennant & Ascending ChannelUPT: 75
DPT: 50
More power to all your trades, my friends!
Ron
Intrepid_Trader

Break Through This And OXT Is Set For ATHOverview
- OXT is beginning to show some bullish price action that could lead to an even bigger breakout. Let's start from the top!
Price Chart
- Bounced off of $0.74 which isn't terrible but never good to bounce off resistances multiple times.
- Break $0.74 and great things will happen. Could easily see $0.85
- Created a channel that OXT could follow through before we see another breakout (Dashed line could be the place price bounces or it could be the solid yellow)
Stoch
- Looking like the yellow trend line was useful as the stoch value bounced off of it and appears to be in a channel as well
RSI
- Have a channel that the RSI has been bouncing in, could see a drop in RSI which would lead to temporary lower prices before another breakout
- What the daily triangle pattern looks like, thought it was interesting and has some "big picture" value
- Also what'd I'd like to see the price do. Don't worry about the time frame moves.
- If a breakout were to happen, could happen before we reach the end of the triangle pattern
If you enjoyed this analysis or learned something new, please like this idea so more people can be aware of the possibilities of this coin.👍
Feel free to follow for for important updates for this coin and trading strategies.🏆
Would also like to know your thoughts! Remember this is not financial advice , however, it is an overview of what I am seeing in this coin's price action.
-Happy Trading,
MoneyGrind

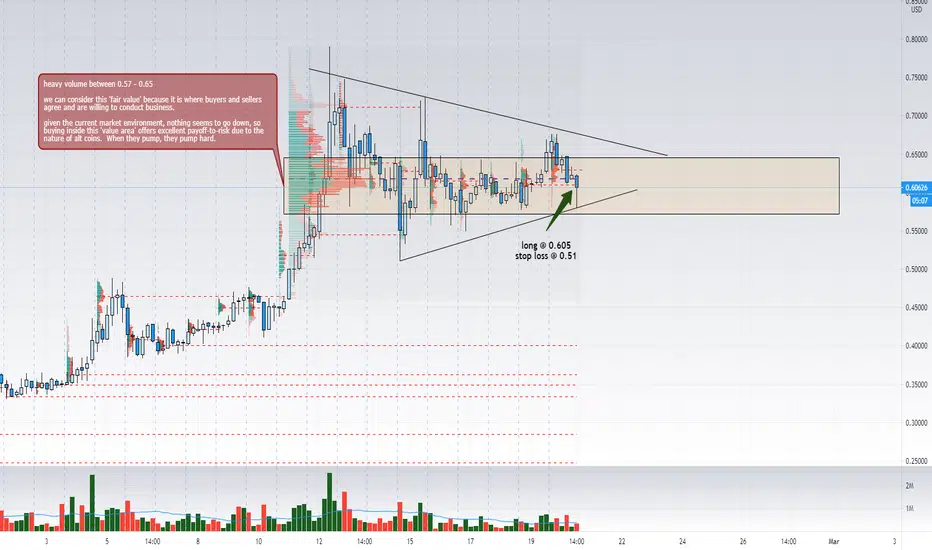
$OXTUSD - Wait for a triangle breakoutHello everyone!
Waiting for a triangle breakout on OXTUSD!
As it seems, the pair has completed the E wave of the 5-wave correction