OXTUSD trade ideas


OXT USD Inverted H&S, Decisions to comeNot a financial advisor, don't invest based off of this. Two major decisions coming up for OXT. First is breakout for the bullish inverted head and shoulders pattern visible in 15m candles, second is a breakout of the long downtrend line from ATH to most recent local high. If both are broken today, OXT could push a first target around $0.6 and eventually retest ATH at $1 by the weekend. Otherwise potentially another week or more of sideways consolidation and the next set of decision points to follow.


OXTUSD Is Fueling Up!Overview
- This Idea will be a little bit shorter than normal as it's just an update but OXT is starting to show some VERY interesting price action and could be indicating that it's time to lift off!
Price Chart
- Price is starting to get so bullish that once it passed $0.43 inside the bullish flag it never looked back. If it breaks through the bullish flag and $0.50, buckle your seatbelts
Where the Rocket Could Fuel Up In The Future
- If the rocket gets to fly past $0.50, we could see the next stop at $0.65, after that $0.78, then to burn the rest of the fuel hopefully to an ATH
If you guys enjoyed this analysis or learned something new, please like this post so more people can be aware of the possibilities of this coin.
As always, if you're invested in this asset or just interested in the price action, feel free to follow for DAILY UPDATES for this coin.
Would also like to know your thoughts! Remember this is not financial advice, however, it is an overview of what I am seeing in this coin's price action.
-Happy Trading


Next Step For OXTUSDHope you all enjoyed waking up to higher prices! This time we'll talk about what the next possible steps will be for this coin.
Overview
- If your short on time, overall OXTUSD still look bullish and needs to break through the $0.48 resistance in order for us to see $0.53. We also could be forming a bullish flag
Price Chart
- I added a bullish flag pattern to the chart in hope this is what occurs. It's possible we could be staying in this area longer ($0.40 to $0.48) , however, if we break that $0.48 resistance, great things are to come.
MACD
- The momentum had surged to the upside but it had stayed along that green trend line. If we break $0.48, expect that to change
Stoch Indicator
- This is why I incorporated this indicator into the mix. If you bought in when the indicator was around the 20.0 value, you're already up 20%!
RSI
- We're finally starting to see that long awaited rise in the RSI, however, we are only at 65.0 so we are neither oversold or overbought. This area (65.0) is an amazing RSI to be at because it sometimes leads to large rallies.
- If you need a quick refresher, oversold is when the value is less than 30.0(Lower the better for longs) and overbought is values over 70.0 (Risky buy in area)
If you guys enjoyed this analysis or learned something new, please like this post so more people can be aware of the possibilities of this coin.
As always, if you're invested in this asset or just interested in the price action, feel free to follow for DAILY UPDATES for this coin.
Would also like to know your thoughts! Remember this is not financial advice, however, it is an overview of what I am seeing in this coin's price action.
-Happy Trading

OXTUSD Getting Closer To That Time!Hope yah all had an awesome Super Bowl Sunday! BTC is now setting ATH's so hopefully altcoins follow!
Overview
- In this Idea I show some new data that is coming in with the bullish OXTUSD price chart starting from the top
Price Chart
- If we look at the previous rise pattern, you'll see that after the price fell about half of the rise, it steadily began to rise before it suddenly popped up again. Could it be possible we see the same thing again? Lets hope
MACD
- On my first idea I was not a fan of the MACD, but as I look at it more it's starting to look better an better for two reasons
- 1) Looking at the MACD (Blue) and Signal (Orange) Lines, you will see that as soon as it hit the green trend line created by the positive momentum, the lines started to shift upwards so we can hope that this pattern continues
- 2) Selling pressure is starting to weaken which could lead to the momentum to turn green resulting in a higher price
Stoch Indicator
- As noted in the last idea, the stoch indicator was falling to the 20.0 range which I interpreted as being a great place to enter a long position or add to your bags. If yah did you're already around 8% up!
- Now we wait for it to return to the low range
RSI
- Pretty much nothing has changed here. We continue to bounce off the green line (Created by the trend of the previous RSI low and when dip occurred)
- However! I did notice that the RSI level that is represented by the red line, was the SAME level that the previous ATH bounced off. Could it do it again?
If you're invested in this asset or just interested in the price action, feel free to follow for DAILY UPDATES for this coin!
Would also like to know your thoughts! Remember this is not financial advice, however, it is an overview of what I am seeing in this coin's price action
-Happy Trading

OXT vs DNT, CVC and NU (YTD return)Coinbase altcoins. The percentage gains in the first week of the year was about the same. But lately OXT seems to be a bit behind. Could be looked as a buying opportunity.

OXTUSD: 2H careful... possible bear flag forming ...?? Did Elon take the bull out of the ALTS like OXTUSD today ????
Caution, looks like 2H forming a possible bear flag.
Will have to see if this short term chart pattern plays out with break of bottom trend line or is this a fake out? Will need to break out above 0.438 for possible uptrend to continue.
Good luck traders!

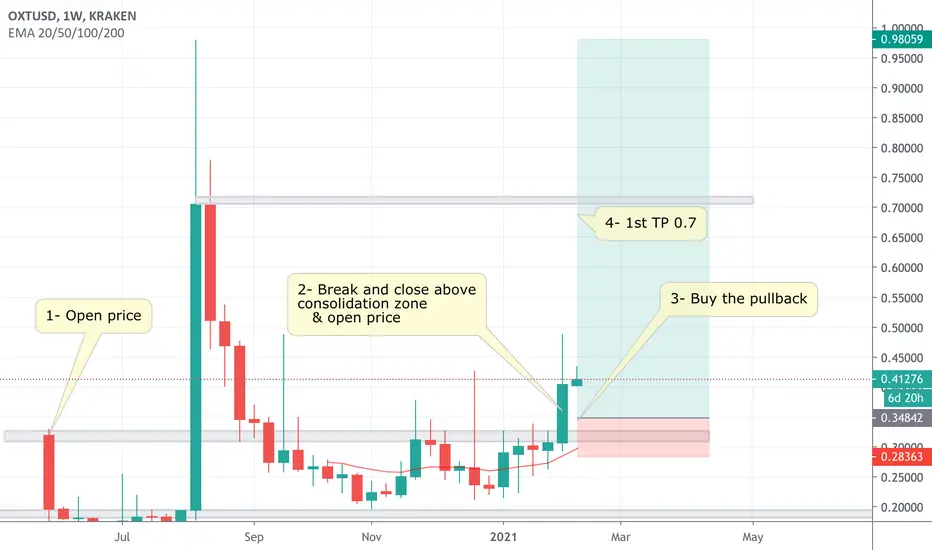
Buy the pullbackWeekly break consolidation zone , good to buy on pull back .
Technical analysis not considering any fundamental .
===Not a financial advice Don’t follow blindly ===
OXT to $1+ soon and possibly $2?OXT has bounced off several times off the 0.236 fib level around $0.3833. The bears seem to be losing steam. Currently into a triple bottom setup in the lower time frame (15m). If OXT can manage to break above $0.43 soon. We will likely see the breakout from the 0.386 fib level soon after. The measured breakout target currently is upto $1.12, the upward longterm channel line is around $1.20 if broken the breakout measured target from $1.20 will be around $2.

OXTUSD Is Coming Closer To Making A DecisionOverview
- BTC falling $2,000+ had a slightly negative impact on the OXTUSD price, however, long-term this may prove to be a good thing for several reasons
Price Chart
- Currently the price is nearing $0.40 after just testing the $0.39 support. My thought is as long as we stay above $0.38 support and BTC doesn't crash, the long position of reaching $1 is still in play
Stoch Indicator
- We are now getting closer to the oversold territory (Anything under 20). This means we now have a safer window to enter the long position or add to our bags
RSI
- In my last post I mentioned the formation of the "W" that could possibly play out. We are now at the stage where we could possibly see a break to the upside in price that would complete this structure. The RSI could also go up or down again making a "W" with two middles before going up, or BTC could crash and the RSI would continue to fall to oversold territory
If you are in a long position in this asset you must continue to be patient and sipping your wine as these price fluctuations shouldn't be anything to worry about
Would also like to know your thoughts! Remember this is not financial advice, however, it is an overview of what I am seeing in this coin's price action
-Happy Trading

OXTUSD Looking Beautiful With The Recent DipOXTUSD is still very bullish in my opinion and I'll tell yah why starting from the top:
Price Chart
- The support at $0.39 was successful at holding with a quick bounce back up to $0.41
- Remember, a higher low was still made during the dip down
MACD
- Only indicator I'm not a fan of because the selling pressure has increased from the previous negative momentum
- However, there is a ascending pattern with the positive momentum so it's possible that pattern could continue ( My gut tells me not more than five bounces and we currently completed three bounces)
Stoch Indicator
- Been using this indicator for awhile now and I've seen that when the descending pattern continues until reaching oversold territory in the RSI(Below 20) the prices go up greatly. (Look at RENUSD 4hr stoch example)
RSI
- RSI is a traders best friend. Incredible bounce that occurs at the 50. as this occurrence usually signals a upside in price when it bounces off the horizontal line of the previous RSI low
OVERALL PREDICTION
- With 3 of the 4 indicators showing bullish signs it's looking like a return back to $0.48 and after that hello $0.53. Be patient and relaxed, good things to come for this coin. Would also like to know your thoughts! Remember this is not financial advice, however, it is an overview of what I am seeing in this coin's price action
-Happy Trading

OXT pump coming in soon!$0.49, $0.61, and $0.75 are in my eyes. Get in while you can before the pump happens.


OXT breaking 4 hour bullish pennant, heading up to $0.39?
OXT breaking bullish flag on the 4 hour chart. This is just a trade for me, I'll probably cash out at price $0.39

oxtusd bullish reversalSame pattern as zrx, just shorter accumulation
Inverse head and shoulders almost completed
If history was to repeat itself, this is likely to shoot parabolic.
Not a financial advice, just an idea


OXTUSD Nice Bull PennantBull Pennant on OXTUSD 4hr chart
Has also just broken out of descending triangle (to the upside), so this is a good continuation pattern/play. High conviction
Duplicating pole gives pt of 0.42, but over 0.37 could honestly fly to previous highs
Really nice setup:
entry would be at bottom white line
Stop loss would be if it breaks below instead of upwards

OXTUSD: 4H looks like bullish pennant might be formingAs above.
Watch for breakout above trendline of the pennant.
Good luck traders!
