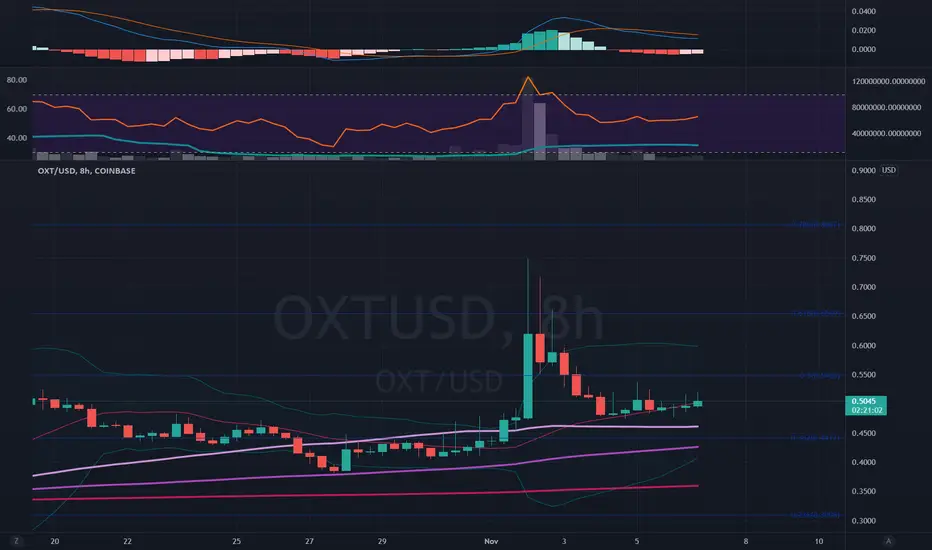
OXT Bulllish setupOXT has been consolidating since touching resistance area around 80ct.
Now that prices have came back close to the Daily MM100, i would see current price action as buy opportunity between current price and 43.5ct.
Once the MACD Daily will turn green this should confirm the plan to go for 80ct first, then above i would be looking at 1.35$ / 1.70$ and 2.20$.
Same as GTC, REQ or ANKR i could have an impulsive move up, better be in before it happen.
OXTUSD trade ideas

Daily Market Update - 7 min rundown of 20+ altcoins gauging tempIn this video:
* Many of the smaller cap altcoins are entering bearish territory
* I believe we are close to finding support for this current crypto correction
* However, many disciplined traders will find themselves having to exit trades
* It's time to exit some coins, take losses, and find a better re-entry condition and setup
* Overall, markets remain in neutral territory. However, smaller cap altcoins are turning bearish.
* jasmy, filecoin, shiba, shibainu, shibusd, ada, cardano, uma, umausd, zcash, zec, zecusd, doge, dogeusd, bat, basic attention token, batusd, oxt, orchid, oxtusd, bitcoin cash, bch, bchusd, ethereum, eth, ethusd, altcoin market, bitcoin dominance, etc.

Orchid, Lets see if history repeats itself???!!! Volatile!!!As you can see on the 4hr chart, the price has reached the bottom line of the channel. The price has retraced 0.618 from the previous rally. Lets see if history will repeat itself. If you want to enter for a position, be extremely cautious, this is a meme coin, the fluctuation can be crazy, super volatile. Volatility is bi-directional. If it goes down, it can turn ugly as well. Be cautious. Not a financial advice. Let me know what is your thought.


OXT vs LPT A VERY IMPORTANT PATTERN IS EMERGING!!!I have been following this pattern since September, and I'm sharing it with you since I believe it's an important one to be aware of... I share this for those that have loyally followed my work! Cheers! If you look carefully, this pattern
can be found on many Altcoins...I'm fortunate here with OXT since I bought it at a much lower price, and I can afford to let the pattern run out, especially if it challenges the lower trend line of the "Launching Triangle".
Regarding the labeling of this chart, it's not necessarily Elliot Wave, but rather, a way of identifying the pattern. So, don't freak out with the labeling!
Have a great day!
Cheers!

Orchid OXTUSD 77 Target reached! Per last video (see "Link to Related Ideas" below) our target has now been reached.
Congratulations Traders!
- Stewdamus

OXT - Ascending Channel and ResistancesWatch these ~1.45 and ~2.00 USD levels as we remain in this ascending channel .

Start of Alt Coin Season will take OXT here! (Bull)OXT to .618 fib and possible wick to the .786
This will be a momentum trend play so stay aware.
I'm glad OXT broke back into its macro-rising formation!

OXT - Elliott Wave 4 almost complete - wave 5 to come!OXTUSD has painted a wedge/triangle as a wave 4. Wave 3 went to nearly $0.75, and now wave 4 is nearly done. Wave 5 is about to come and should get back to $0.75 and go beyond it! With Pantera capital as one of the investors in OXT, we should easily see prices above $1
Not financial advice.

$OXT Fractal is ready to make its move IMO...$oxt about to tear to @$2.50-$4.00 in next week in line with this fractal from the previous monster 4x pump to $1 from around this time last year. Lets wait and see what we get...

OXT 1HR - PUMPING BUT RSI HIGHOXT is doing very well but RSI on the 1H, 4H are very high. Possible cool down before a potential next leg up (similar to the last pattern).
What are your thoughts? Comment below and hit the like please. Thank you!
Disclosure: This is just my opinion and not any type of financial advice. I enjoy charting and discussing technical analysis . Don't trade based on my advice. Do your own research! #cryptopickk #bitcoin #altcoins

OXT consolidation before breakoutOXT has been consolidation during the second part of October and found support on technical area, Daily MM100 and Weekly MM20.
Im expecting a bounce from here which would take another few days to develop with a slow increase before a potential pop targeting 80ct.
The signal for a return of the bull would be given by MACD Daily turning green or a break above the 50ct.
As long as we are above 34ct my plan is not changing and i still see it as buying opportunity on mid term time frame

OXTUSD Orchid Next Stop 79 Cents! How to play this trade.In this video we discuss:
79 cents target
Levels
[*} Trade strategy
Profit taking
Time till launch

#OXT Orchid 1D ChartOXT hasn't touched the top of the trend line in over 200 days as shown in the chart. RSI seems to be ready for a nice move if the upside comes. Let's see!
What are your thoughts? Comment below and hit the like please. Thank you!
Disclosure: This is just my opinion and not any type of financial advice. I enjoy charting and discussing technical analysis . Don't trade based on my advice. Do your own research! #cryptopickk #bitcoin #altcoins

OXT Middle range for top rangeOXT had a strong breakout of 44ct / 33ct which is the centre of the range with high volumes.
Im expecting the prices to retest this area, MACD Weekly has just turned green and the Daily is also bullish. OXTBTC pair seems to have find support and if confirmed could push the usd prices higher.
Anything between current price and 40ct (35ct as max bottom) should be seen as buying opportunity with 1st target at 80ct.

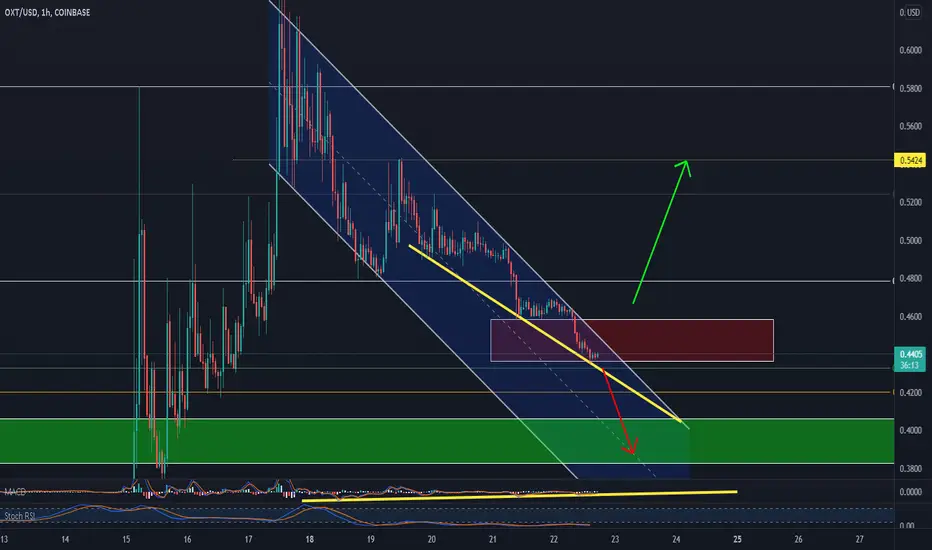
OXT - Falling WedgeUPT: 5424
DPT: 4000
MACD: Bullish Divergence
Stoch RSI (4H): Oversold Conditions
Watching the descending resistance line of the falling wedge.
Price action is KING!
Ron
Intrepid_Trader
OXTUSD Orchid Fell Below Support. Down Before Up.
Are we still headed to 75 Cents?
What happens before we get to 75 Cents?
How much more downside can we expect before further upside?

OXT - Descending TriangleWatching the white trend line.
UPT: 0.54
DPT: 0.43
Price action is KING!
More power to all your trades, my friends!
Ron
Intrepid_Trader

OXT - Right Up At The 50If the 50EMA holds, bounce could bring OXT to 54
Continued price descent could bring OXT down to 43
Price action is KING!
More power to all your trades, my friends!
Ron
Intrepid_Trader

OXTUSD Orchid - Now on to 75 cents?BLUF:
OXT extremely bullish
OXT broke 4 huge resistance lines in 3 days
OXT now rests on strong support
OXT headed to 75 cents?

OXT - SUPER BULLISH W PATTERN FORMINGOXT has painted an extremely bullish W pattern on weekly timeframes. Would not be surprised to see prices above $1 in the next few weeks.
Not financial advice.

OXTUSD Orchid Hit 48 CENTS Resistance Exactly. Now Where To NextThe previous video explained the bullish behavior of OXT.
Inside bullish triangle
Consolidation phase nearing an end
Testing huge resistance many times
Etc. (see link to Related Ideas below)
In this video, I analyse the greatest probability of where OXT goes next:
Currently hitting our heads on resistance at 48 cents
How strong is the 48 cent resistance line?
Where did the 48 cents resistance come from? How did I develop it?
What will OXTUSD do next? Greatest play scenariors.
