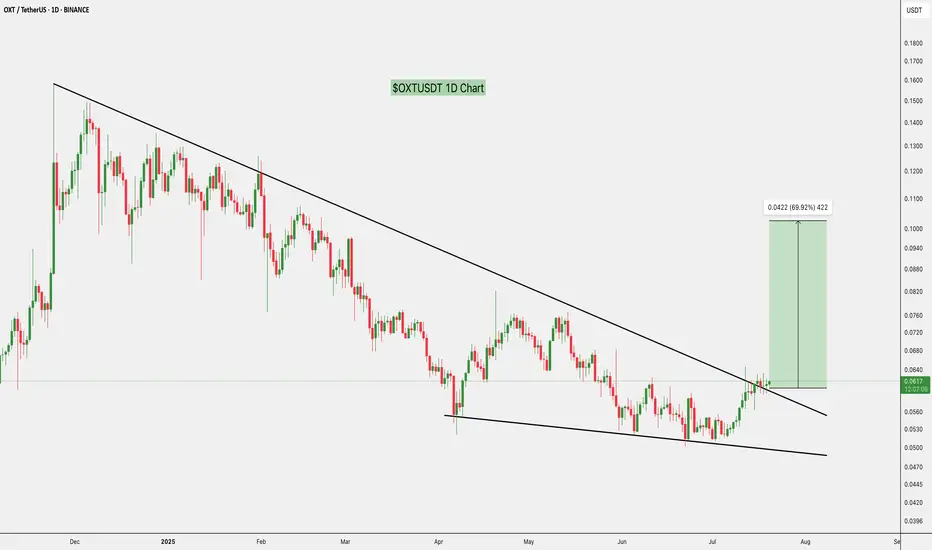
$OXT Breaks Out, 70% Rally on the TableASX:OXT has broken out of a long falling wedge, a bullish signal.
If it holds, we could see a move toward $0.105 (+70%).
Watch for a retest to confirm the breakout.
DYOR, NFA
Related pairs
Orchid 290% Profits Target, MA200 & Price Action FractalThe classic signals are already present on this chart, the double-bottom, etc. But I also have a price action fractal plus an unconventional signal supporting a bullish jump.
The easy target here is 290%, it can be hit within months. Not more than two to be more exact after the bullish breakout is

Will Orchid (OXT) rally to broken market structure?On the above 5 day chart price action has corrected almost 70% since the year began. A number of reasons now suggest a reversal in trend, they include:
1. Price action and RSI resistance breakouts.
2. A significant confirmation that legacy downtrend breakout now acts as support.
3. Price action con

Long OXTGood moment to try to Buy OXTUSDT. We have ready temporary low point that can be a first point in the forming new up trend. Also before we can see 3 fast move down and back days. It can be good signals that instrument to take a power for future move up. Now the good moment to take it with good risk

UpdateThe only good thing about this chart is that for now price is holding onto EMA 150 support. If price loses this support and breaks below the daily EMA 150 it means you have to accept that this project is still in a bear market. For us to confirm that there’s a bull market ahead of us, price needs to

HUGE opportunity for $OXTThe breaking of the triangle is imminent, matter of hours/days if the trend continue in this way.
Otherwise there will be one last push back before the next ATH, don't sleep on this one.

WeakPrice keeps failing to generate higher highs, while it has done a good job of forming lower lows. Soon If price fails to break above 12 cents and stay above this level, it could mean there’s no buying pressure which would potentially drag the price down back to around 8-9 cents. This is a crucial do

OXT Looks Bearish (4H)It seems that from the point where we placed the red arrow on the chart, OXT has entered a complex correction. This correction appears to be either a Diametric or a Symmetric pattern.
From the red zone, it can drop towards the specified targets.
Currently, it seems to be in the early stages of wav

OXT drop and rise !#OXT hit a demand zone and now targeted a demand zone in lower prices i think this demand zone is unbreakable it can hold the market as it is made by 2 different demand lines !
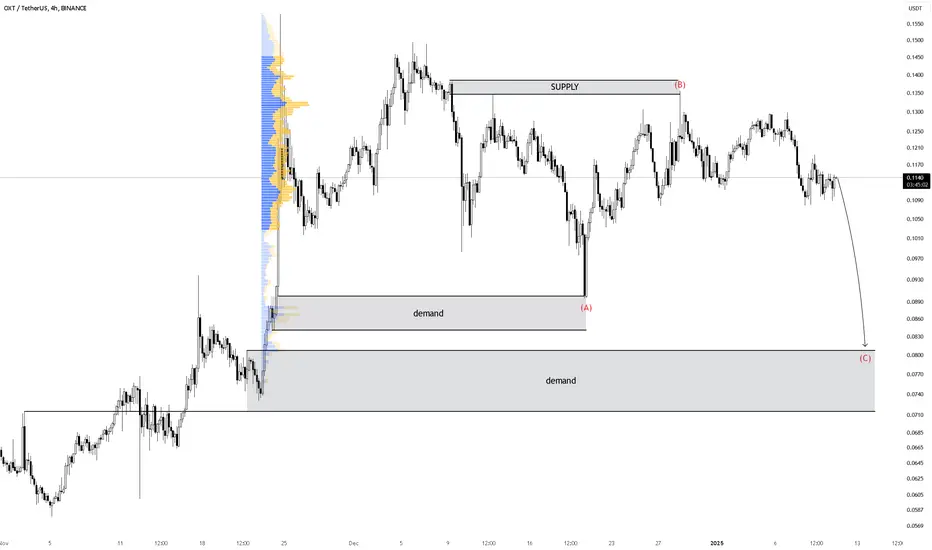
Error 404OXT failed to break out of the symmetrical triangle. Price is now heading back down to the support line of the triangle. If price fails to hold onto the support, OXT will bleed out bad. We all thought alt season is here, but it’s not. And with the DXY rising it’s taking down the entire market down w

See all ideas
Summarizing what the indicators are suggesting.
Oscillators
Neutral
SellBuy
Strong sellStrong buy
Strong sellSellNeutralBuyStrong buy
Oscillators
Neutral
SellBuy
Strong sellStrong buy
Strong sellSellNeutralBuyStrong buy
Summary
Neutral
SellBuy
Strong sellStrong buy
Strong sellSellNeutralBuyStrong buy
Summary
Neutral
SellBuy
Strong sellStrong buy
Strong sellSellNeutralBuyStrong buy
Summary
Neutral
SellBuy
Strong sellStrong buy
Strong sellSellNeutralBuyStrong buy
Moving Averages
Neutral
SellBuy
Strong sellStrong buy
Strong sellSellNeutralBuyStrong buy
Moving Averages
Neutral
SellBuy
Strong sellStrong buy
Strong sellSellNeutralBuyStrong buy
Displays a symbol's price movements over previous years to identify recurring trends.
Frequently Asked Questions
The current price of OXT / TetherUS (OXT) is 0.0617 USDT — it has risen 1.33% in the past 24 hours. Try placing this info into the context by checking out what coins are also gaining and losing at the moment and seeing OXT price chart.
OXT / TetherUS price has risen by 0.16% over the last week, its month performance shows a 16.00% increase, and as for the last year, OXT / TetherUS has decreased by −23.64%. See more dynamics on OXT price chart.
Keep track of coins' changes with our Crypto Coins Heatmap.
Keep track of coins' changes with our Crypto Coins Heatmap.
OXT / TetherUS (OXT) reached its highest price on Apr 5, 2021 — it amounted to 1.0400 USDT. Find more insights on the OXT price chart.
See the list of crypto gainers and choose what best fits your strategy.
See the list of crypto gainers and choose what best fits your strategy.
OXT / TetherUS (OXT) reached the lowest price of 0.0465 USDT on Jun 15, 2023. View more OXT / TetherUS dynamics on the price chart.
See the list of crypto losers to find unexpected opportunities.
See the list of crypto losers to find unexpected opportunities.
The safest choice when buying OXT is to go to a well-known crypto exchange. Some of the popular names are Binance, Coinbase, Kraken. But you'll have to find a reliable broker and create an account first. You can trade OXT right from TradingView charts — just choose a broker and connect to your account.
Crypto markets are famous for their volatility, so one should study all the available stats before adding crypto assets to their portfolio. Very often it's technical analysis that comes in handy. We prepared technical ratings for OXT / TetherUS (OXT): today its technical analysis shows the buy signal, and according to the 1 week rating OXT shows the sell signal. And you'd better dig deeper and study 1 month rating too — it's sell. Find inspiration in OXT / TetherUS trading ideas and keep track of what's moving crypto markets with our crypto news feed.
OXT / TetherUS (OXT) is just as reliable as any other crypto asset — this corner of the world market is highly volatile. Today, for instance, OXT / TetherUS is estimated as 1.98% volatile. The only thing it means is that you must prepare and examine all available information before making a decision. And if you're not sure about OXT / TetherUS, you can find more inspiration in our curated watchlists.
You can discuss OXT / TetherUS (OXT) with other users in our public chats, Minds or in the comments to Ideas.