Palladium Monthly Chart Short After AB=CD=CD Palladium After a big up move get to a very very strong resistance
Price end AB=CD then make another CD leg, now gonna fall
This trade has a very high success rate to Take profit 1
PALLADIUM trade ideas

No fundamentals just algorithm.Whilst I'm usually following the news. This time it looks like it's making a correction based on algorithms. Ideas?

Is Palladium tumbling down ?I certainly hope so as selling at this high price to the desired target would yield a great amount of
profits to any traders.
A very bearish candle has just taken place in the 4H chart, let's be patient and see the strength of pull back and then place our sell bet. For all you know, this commodity which has been generating more than 350% return since 2016 (parabolic move) is in need of a serious correction.
watch this like a vulture and not let it off your sight........


[PALLADIUM] SHORT TRADEHi traders,
we will see palladium 1600 dolars.
divergence in week and we have nice pull in daily.
Juanma

Palladium Slowing Down at $2,000!If price can climb another 60 points and go beyond the $2,000 mark then it would be creating new
record highs for this commodity, which in 2016 was only priced as low as $454.
It has travelled some way since then to where it is now and that journey has not been the smoothest.
After the smooth linear trend from August 2018 to March 2019, price took a turn and went
into consolidation. The sideways movement continued like that for 6 months before the trend resumed.
What traders have to realise is that a period of consolidation does not write off a trade and
quite often just indicates exhaustion in the market before momentum kicks back in and we see a trend continuation.
The last pullback was held and pushed back up by the 50sma, which also pushed price through
the previous resistance at $1,823. We will have to see if that same momentum will push price
through the $2,000 psychological round number and beyond.
We will share updates if and when we see new all-time highs created.
See below for more information on our trading techniques.
As always, keep it simple, keep it Sublime.


Palladium: 2400 before 2021; Strong Bull Throughout 2020Palladium has soared over the last little while especially, but even so, over the past 12 months.
My hypothesis has remained correct and will continue to remain correct: as long as equities are bullish, so too, will Palladium. I believe there will be a 5-10% correction sometime in Q1 of 2020 (impossible to know exactly how much), and perhaps another correction late 2020, however, i believe before the end of 2020 Palladium will reach about 2400 which I am predicting as the top for now.
The long-term future of Palladium remains strong, but with any precious metal, you can expect at-least a 30% consolidation level before the next run-up.
Long until Q1 2020
Watch for a short in Q1 2020 (for Palladium and equities)
Long from Q2 2020
Prepare for short and consolidation as 2020 ends
*Note: Chart is not 100% exact but present to show the general trend.
- zSplit

#palladium is back after friday big retrace, reaching 2000#palladium is back after friday big retrace, reaching 2000, palladium is now far beyond gold and nothing show trend stop in 2020 ...

Palladium When Does The Ride Stop?Palladium has had a massive drive up in price. Previously below platinum, it's come into it's own. The market is tightly controlled by a few major players, and possible supply interruptions helping fan the bull flame.
$2000 Rejection most likely profit taking, and an outlook over $2K imminent. I am waiting to take a short position though, as a rally like this has the potential to unwind quickly, and the upside at some point will be capped.
Key points of support sit at
$1835, $1700, then $1600 in the short term.
Will also be watching RSI for a short on any overbought rallys over $2K mark in the next few weeks. Whilst keeping an eye on news of the current supply/demand fundamentals in the case of a continued rally to future gains.


palladium near new target 2k palladium near new target 2k : price is better than arrow target so nice

In A Potential Top Zone...This has been a great run and is in the completion zone for wave 3 in a long term count, sure it can go 10-20% higher but it's probably close to done and will enter a 2-3 year down cycle...and may even take 5+ years to even break this wave 3 high.


palladium target 1900 soonpalladium is best metal in 2019 far from gold and 2020 could be delicious , 2019 end of year 1900 then 2020 , 2k ?

palladium new target : 2k is palladium enough crasy to hit 2k before end of year ... it's our new target for 2019 end and 2020 start


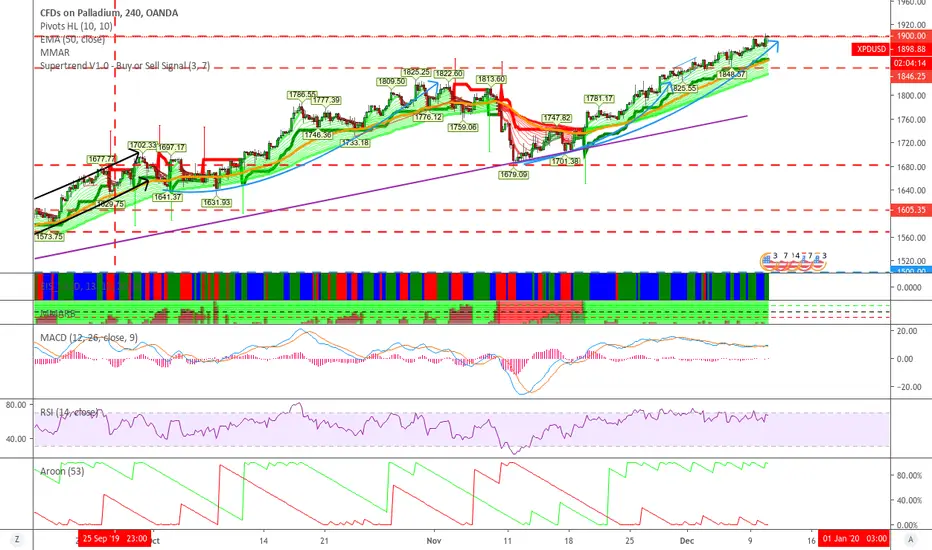
Short Palladium @ 1,900; TP @ 1,520, SL your choiceShort Palladium @ 1,900; TP @ 1,520, SL your choice. Small position going long term.

1900 hit , our end of year target hit now cool and relax 1900 hit , our end of year target hit now cool and relax


PALLADIUM - In the middle of next week... (?)In the middle of next week it might be possible that the yellow 5 comes to an end.
Here are 3 potential levels:
* 1911.34 is the 1.618% Fib of the yellow wave 4
* 1925.39 is the Fib Ext of the yellow waves 1 & 2
* 1939.72 is 200% of the yellow wave 1
Or just keep an eye on the upper edge of the trend channel as the last limit.
For an A B C correction, the first confirmation for falling prices would be break and close on a daily basis under the red line @ 1840

@XPDUSD@Palladium
1/ Ascending wedge
2/ Bearish divergence H1/H4/weekly
3/ Bullish extreme sentiment
What more shall we need to short it ?
"Its not a trade recommandation"
