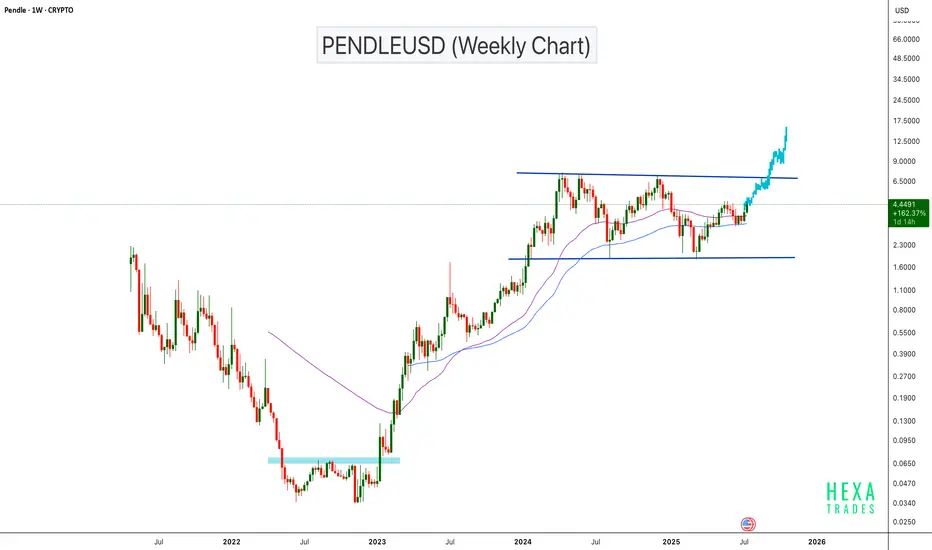
PENDLEUSD Bullish Continuation Setup!BINANCE:PENDLEUSDT has surged approximately 20,000% from its bottom, showing exceptional long-term strength. The price is now approaching a major horizontal resistance zone on the weekly chart. If the price breaks the parallel channel resistance, we can expect a bullish continuation with a psycholo
Key stats
About Pendle
Related coins
The bulls have left the building—time for the bears to party.PENDLE currently at strong support zone on weekly timeframe.
Break of this support could trigger a massive fall downwards. Chart is self explanatory.
Note: This is not Buy/Sell Recommendation. DYOR always & always.

PENDLE RWA Bullish Chart prediction 2025Pendle has been excellent in 2024. The project is delivering and moving to the Top 50 is possible.
Given its market cap to be sitting around $600M only, means it can have the same upside as AAVE as PENDLE is RWA and tokenization for LINK and Axelar. If you don’t hold PENDLE in your portfolio, you

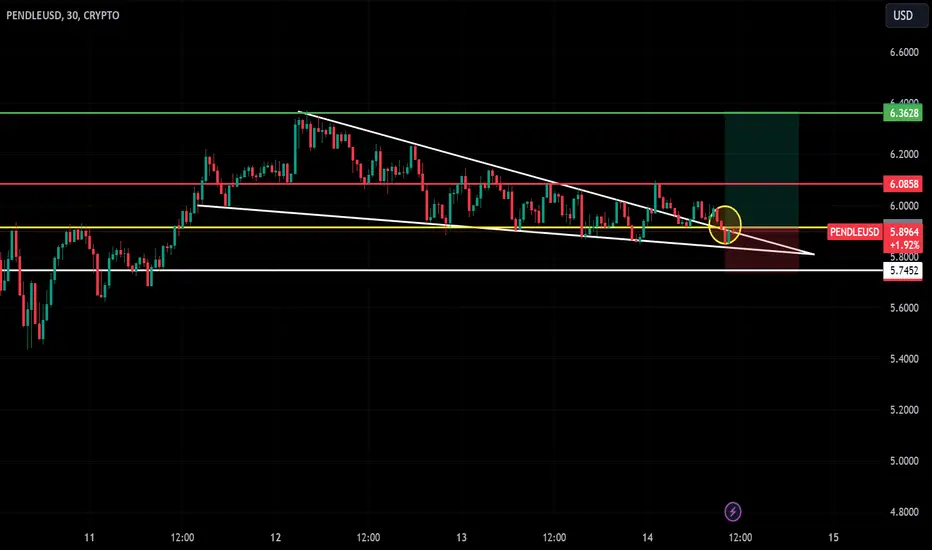
Descending Triangle Breakout on PENDLEUSD - Trade.The PENDLEUSD chart shows a descending triangle breakout on the 30-minute timeframe. Key levels to watch:
Entry Point: Near the breakout zone, confirming bullish momentum.
Stop Loss: Set below the triangle support at 5.7452 for risk management.
Take Profit: Targeting 6.3628, aligning with the next
CTRL+ALT+DELETEIts time to put the power back in the peoples hands.
#BUY #BUY #BUY
**USE PROPER RISK MANAGEMENT**

PENDLE "most active in Russia" Pendle is most active in Russia at 20%. Data from crunchbase powered by semrush.

Pendle is looking to launch to $28Undoubtedly one of the winners of the cycle.
Already done hundred's of X's
YET
consolidating near it's high's in a #HVF continuation pattern @TheCryptoSniper
With the larger projection over a 4X from here.

Bidding Pendle BreakoutIt seems like our favourite (is this how you spell it) RWA coin is attempting a breakout again.
I had initially planned to wait for the 4th test on resistance. However after waiting a few more days it looks like Pendle is ready to run this time.
There has been significant accumulation throughout


Mission accomplished! Now watch Pendle shoot for the moon...As expected, the last leg of correction in Bitcoin drove Pendle to the Fib it missed on the way up. Expect the remainder of this week to be a bit wobbly and unpredictable and then watch Pendle shoot for the moon in the months ahead!

See all ideas
Summarizing what the indicators are suggesting.
Oscillators
Neutral
SellBuy
Strong sellStrong buy
Strong sellSellNeutralBuyStrong buy
Oscillators
Neutral
SellBuy
Strong sellStrong buy
Strong sellSellNeutralBuyStrong buy
Summary
Neutral
SellBuy
Strong sellStrong buy
Strong sellSellNeutralBuyStrong buy
Summary
Neutral
SellBuy
Strong sellStrong buy
Strong sellSellNeutralBuyStrong buy
Summary
Neutral
SellBuy
Strong sellStrong buy
Strong sellSellNeutralBuyStrong buy
Moving Averages
Neutral
SellBuy
Strong sellStrong buy
Strong sellSellNeutralBuyStrong buy
Moving Averages
Neutral
SellBuy
Strong sellStrong buy
Strong sellSellNeutralBuyStrong buy
Displays a symbol's price movements over previous years to identify recurring trends.
Frequently Asked Questions
The current price of Pendle (PENDLE) is 3.7107 USD — it has fallen −0.02% in the past 24 hours. Try placing this info into the context by checking out what coins are also gaining and losing at the moment and seeing PENDLE price chart.
The current market capitalization of Pendle (PENDLE) is 615.71 M USD. To see this number in a context check out our list of crypto coins ranked by their market caps or see crypto market cap charts.
Pendle (PENDLE) trading volume in 24 hours is 67.87 M USD. See how often other coins are traded in this list.
Pendle price has fallen by −12.66% over the last week, its month performance shows a 11.02% increase, and as for the last year, Pendle has increased by 9.05%. See more dynamics on PENDLE price chart.
Keep track of coins' changes with our Crypto Coins Heatmap.
Keep track of coins' changes with our Crypto Coins Heatmap.
Pendle (PENDLE) reached its highest price on Apr 11, 2024 — it amounted to 7.5304 USD. Find more insights on the PENDLE price chart.
See the list of crypto gainers and choose what best fits your strategy.
See the list of crypto gainers and choose what best fits your strategy.
Pendle (PENDLE) reached the lowest price of 0.0338 USD on Nov 13, 2022. View more Pendle dynamics on the price chart.
See the list of crypto losers to find unexpected opportunities.
See the list of crypto losers to find unexpected opportunities.
The number of PENDLE addresses is 138.03 K and the count of active addresses is 1.32 K.
The average balance in USD is 18.95 K.
The current circulating supply of Pendle (PENDLE) is 281.53 M USD. To get a wider picture you can check out our list of coins with the highest circulating supply, as well as the ones with the lowest number of tokens in circulation.
You can judge how popular Pendle (PENDLE) is and how actively traders buy and sell it by its number of transactions - it's now reached 2.61 K, which is 15.71 M USD.
Average PENDLE transaction in USD is 6.01 K. You can find even more Pendle stats in our Crypto Coins Screener.
The safest choice when buying PENDLE is to go to a well-known crypto exchange. Some of the popular names are Binance, Coinbase, Kraken. But you'll have to find a reliable broker and create an account first. You can trade PENDLE right from TradingView charts — just choose a broker and connect to your account.
Crypto markets are famous for their volatility, so one should study all the available stats before adding crypto assets to their portfolio. Very often it's technical analysis that comes in handy. We prepared technical ratings for Pendle (PENDLE): today its technical analysis shows the sell signal, and according to the 1 week rating PENDLE shows the neutral signal. And you'd better dig deeper and study 1 month rating too — it's neutral. Find inspiration in Pendle trading ideas and keep track of what's moving crypto markets with our crypto news feed.
Pendle (PENDLE) is just as reliable as any other crypto asset — this corner of the world market is highly volatile. Today, for instance, Pendle is estimated as 9.16% volatile. The only thing it means is that you must prepare and examine all available information before making a decision. And if you're not sure about Pendle, you can find more inspiration in our curated watchlists.
You can discuss Pendle (PENDLE) with other users in our public chats, Minds or in the comments to Ideas.