PENGU Trade SetupPENGU Trade Setup – Rebound in Play
PENGU is showing a strong rebound from its support trendline, aligning well with the broader market momentum. If it continues to follow the current trend, we could see up to a 45% rally 📈.
📌 Strategy:
~ Entry: $0.012 to CMP
~ Stop Loss: $0.0105 🛡️
~ Leverage: 5

$PENGU Breakout!!#PENGU is showing signs of strength after breaking out of the falling wedge and reclaiming the support zone.
🔹 Breakout from wedge confirmed
🔹 Holding above 200 EMA – a sign of strength
🔹 Clean bounce from support zone with rising volume
🎯 Target: $0.0156
🛑 Stop-loss: $0.0110 (below wedge & suppor

PENGU Pengu range mid reclaim, if Pengu breaks red box would look for sweep of ATHs. Looking for longs and spot.

PENGU 12H – System Entry Triggered
PENGU just gave a system entry on the 12H time frame.
📌 The black line represents entry points from the 3D and 1W time frames. It has acted as a key level in the past and has now been flipped into support again.
📈 Price is currently pushing into the pink box, which may act as short-term resistanc

PENGUUSDT Breaking Bullish Flag – Eyes on 0.03PENGUUSDT is breaking out of a bullish flag pattern, a classic continuation signal in an uptrend. The breakout is occurring with strong momentum, supported by the RSI crossing above the 50 zone on the 8H timeframe, adding further confidence to bullish bias.
📊 Key Levels:
TP1: 0.382 Fibonacci –

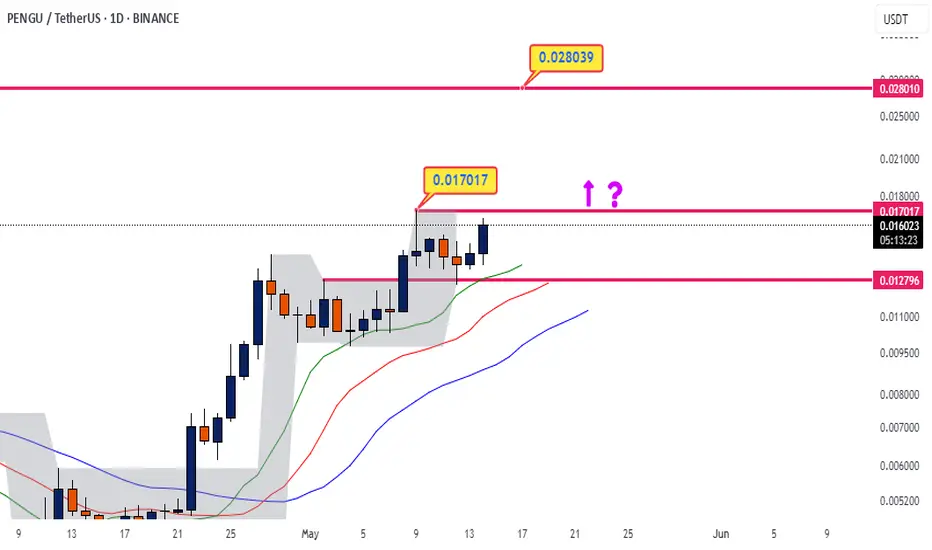
Crossing the fractalThe price has the potential to grow to 0.03 if it breaks the daily fractal of 0.017 and consolidates above it
#PENGU Coin Looks Strong on H1 – As Long As We Hold the Purple
#Pengu Coin Looks Strong on H1 – As Long As We Hold the Purple Zone! 🟣📈
#Pengu Coin is looking technically bullish on the H1 chart, though it's a bit risky.
As long as price stays above the purple support area, upside potential remains alive! 🚀
Break below = caution. Stay alert.
Not financial adv

PENGU CONSOLIDATION - When Breakout?CSECY:PENGU has been seen to range within the box on the 1hr timeframe chart since Thursday 8th May and it’s still within the box. Trade with caution.
Please support this idea with a LIKE👍 if you find it useful🥳
Happy Trading💰🥳🤗

UpwardsMini flag looking for a breakout pretty soon. Meme coins seem to be performing quite well the past couple weeks which could be a nice tailwind

Pudgy Penguins (PENGU): 23.05.2025Seeing signs of weakness on PENGU coin, where recently we've been having a few short squeeze candles near the same area, which is showing that soon we might see the reversal of the trend.
We are looking for another squeeze to happen after what we will be looking for short here, but we might not se

See all ideas
Summarizing what the indicators are suggesting.
Oscillators
Neutral
SellBuy
Strong sellStrong buy
Strong sellSellNeutralBuyStrong buy
Oscillators
Neutral
SellBuy
Strong sellStrong buy
Strong sellSellNeutralBuyStrong buy
Summary
Neutral
SellBuy
Strong sellStrong buy
Strong sellSellNeutralBuyStrong buy
Summary
Neutral
SellBuy
Strong sellStrong buy
Strong sellSellNeutralBuyStrong buy
Summary
Neutral
SellBuy
Strong sellStrong buy
Strong sellSellNeutralBuyStrong buy
Moving Averages
Neutral
SellBuy
Strong sellStrong buy
Strong sellSellNeutralBuyStrong buy
Moving Averages
Neutral
SellBuy
Strong sellStrong buy
Strong sellSellNeutralBuyStrong buy
Displays a symbol's price movements over previous years to identify recurring trends.