Insider Selloff + Liquidity Sweep🔻 PENGU/USDT TRADE IDEA 🔻
📣 Hey CandleCraft crew!
Today we’re diving into a chilly little bird that flew a bit too close to the heat. 🐧 PENGU pumped hard — but when team wallets start dumping $17M worth of tokens, that’s not bullish, that’s suspicious. Think iceberg ahead.
🔥 TRADE SETUP
Bias: Short
Strategy: Insider Selloff + Liquidity Sweep
Entry: $0.036 – $0.038
SL: $0.041
TPs: $0.030, $0.025, $0.018
Why?
– HTF sweep of liquidity above $0.04
– Insider wallet moved 485M tokens to exchanges
– LTF CHoCH + RSI breakdown
– Price hovering under 20-day EMA with weakening volume.
Candle Craft | Signal. Structure. Execution.
PENGUUSDT.P trade ideas

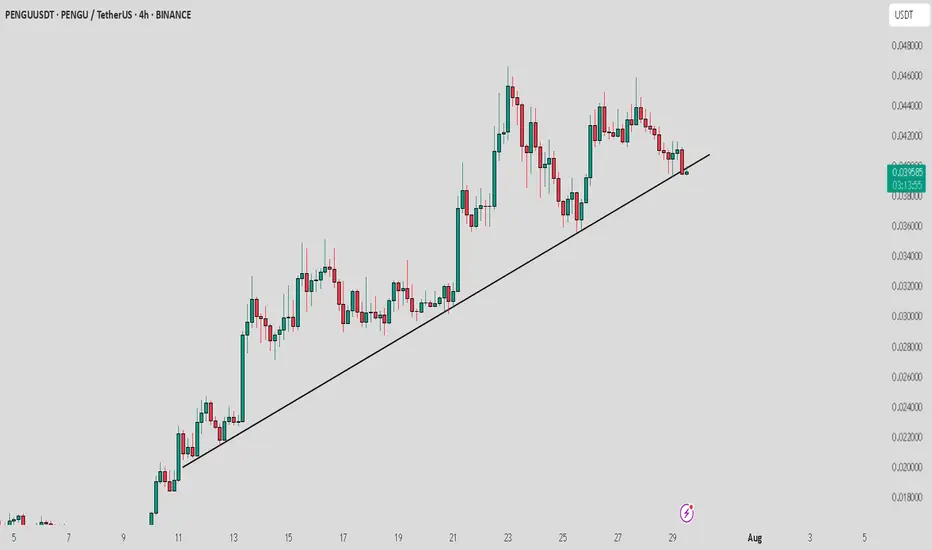
PENGU / USDT : Breaking down from Trendline supportPENGU/USDT is breaking down from the trend line support, but the retest is still in progress. Watch for rejection at key levels.
Pro Tip: Wait for confirmation of rejection before entering the trade and always apply proper risk management to safeguard your position.
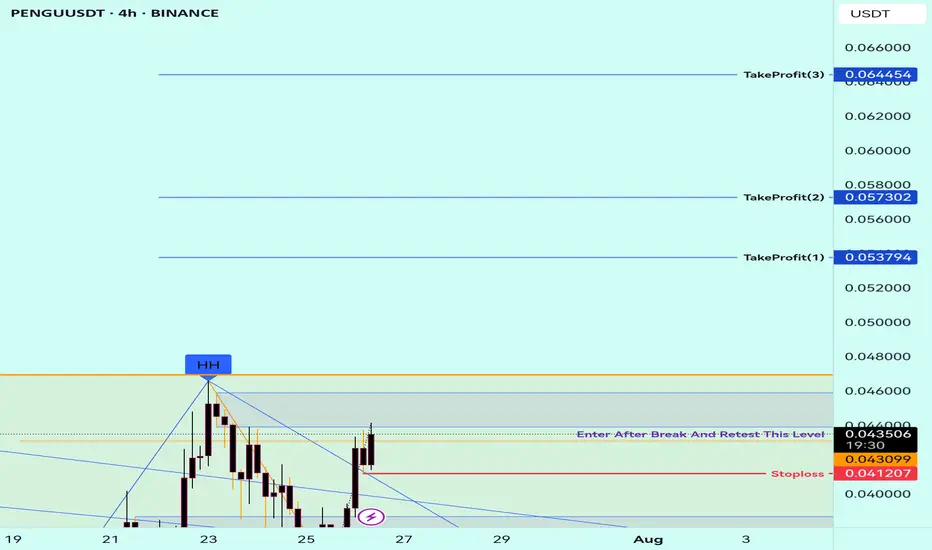
Pengu weekend swing longJust now opened a swing long position on pengu. Targeting $0.07
However if market starts rejecting $0.047 might have to exit earlier.
Time sensitive I don't think this one will pullback much we have some ground to cover
SL: $0.037
PENGU. Main trend. Trend reversal zone. 04 07 2025Logarithm. Main trend. Fresh cryptocurrency, which is being driven into hype.
Locally now. Price at the median of the bowl.
Buyer volume dominates. Most likely, there will be a large pump in case of a breakout.
The chart is somewhat reminiscent of the Bitcoin chart, the reversal zones of this secondary trend, after the first local wave of growth. The first local, significant target is shown.
There is a possibility of a helicopter, that is, to collect stops in both directions, and thereby dump passengers before a potential pump.
Such cryptocurrencies (low liquidity, monopoly over the price due to the concentration of cryptocurrency in “one hand”) at a good time "the hamster is not scared", will be pumped up conditionally, like Shiba Inu (SHIB), driving the hype (raising the price over and over again, and coming up with positive news) and 0.5 million Twitter subscribers (X). Medium-term — long-term level zones are shown on the chart.

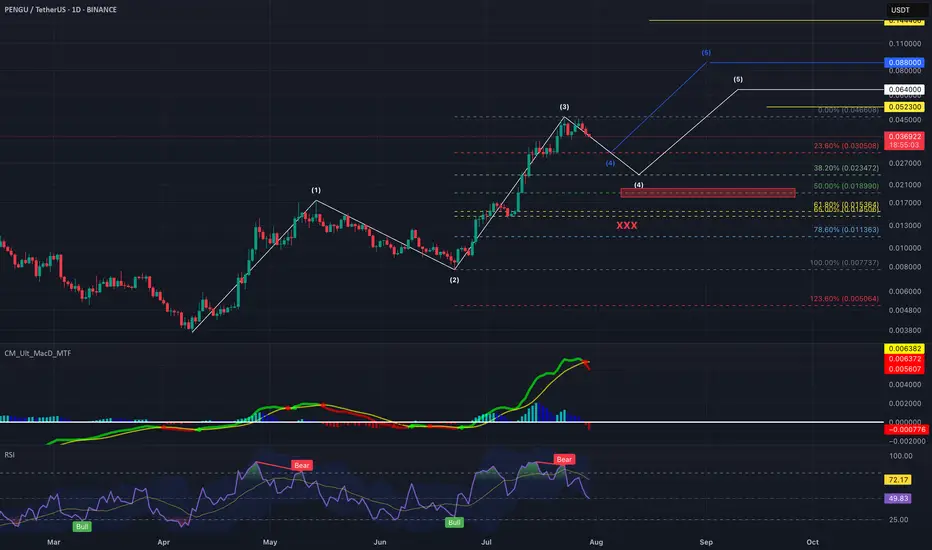
PENGU Update | Elliott Wave Cooling Before Final Push?Our original analysis anticipated this pullback and it’s playing out beautifully. Wave 3 wrapped up at 0.0466, and we’re now seeing signs of a healthy Wave 4 retracement.
Current Structure
Wave 3 completed from 0.0077 to 0.0466. Really strong wave 3.
Now retracing with:
- MACD bearish crossover
- RSI bearish divergence
And Wave 4 pullback zone is likely between 0.0305 – 0.0255 (Fib 0.236–0.382 of Wave 3)
We're now in the cool-down phase, with momentum indicators rolling over. The red box around 0.0185–0.0200 is key support. If that holds (Wave 1 high), structure remains valid for a Wave 5 extension.
Wave 5 Upside Targets are
0️⃣ $0.0438 – $0.0473 (Base case recovery)
1️⃣ $0.0523 (Typical Wave 5 projection)
2️⃣ $0.0640 (Extended Wave 5)
3️⃣ $0.0880 Parabolic (FOMO scenario, 10% chance)
Breakdown below Wave 1 invalidates the count (red box region). CSECY:PENGU has been leading the meme sector this cycle, and there’s no more "positive" news around NYSE:PUMP to drain liquidity yet. So, I believe we might actually see a shallow pullback.
This Wave 4 is likely the last dip before a clean leg up. Unless macro FUD derails the market, we expect continuation into Wave 5.
Patience is key. Let the retrace finish. Then… maybe moon. 🌝
Pudgy Penguins (PENGU): Huge Volatile Movement IncomingPengu coin seems to be in a pretty dangerous zone; while we are hovering near the ATH and seeing some smaller pullback prices, we are yet to see the potential huge breakout take place or breakdown happen.
We have marked 2 zones to keep an eye on; if either of those zones is broken, a huge volatile movement will happen so be careful!
As long as we are above the Sell Zone, we are going to look for more MSB areas for smaller long scalps!
Swallow Academy

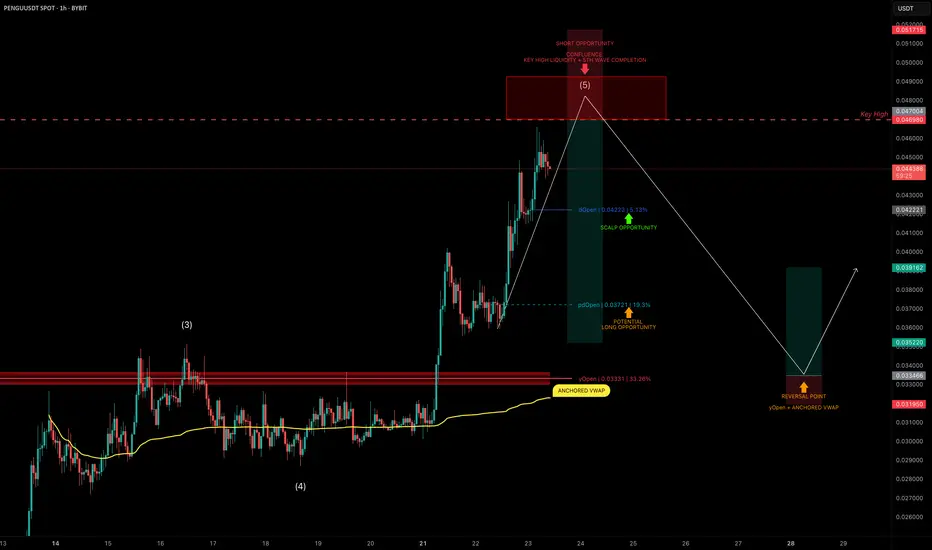
PENGU Topping Out? Targeting 30% Downside After Liquidity SweepPENGU has had an explosive run, but it now looks to be nearing completion of wave 5 of its current Elliott impulse.
We’re approaching a key high at $0.04698, a likely liquidity grab zone — and potentially a great area to position for a short trade.
🧩 Short Setup Overview
➡️ Wave 5 Completion Incoming:
Price is showing signs of exhaustion as it approaches $0.04698, where liquidity is likely stacked above the previous high.
➡️ SFP Trigger Zone:
Watch for a swing failure pattern (SFP) at $0.04698 — confirmation for a potential short entry.
➡️ Psychological Resistance:
The $0.05 level also sits just above — a classic psychological barrier that may get tapped or wicked into.
🔴 Short Trade Setup
Entry: After a confirmed SFP at $0.04698–$0.05
Target (TP): Yearly Open (yOpen) — potential move of ~30%
Stop-loss: Above post-SFP high
R:R: Excellent asymmetry if setup confirms
🛠 Indicator Note
In this analysis I'm using my own indicator called "DriftLine - Pivot Open Zones ", which I recently published.
✅ It helps highlight key open levels, support/resistance zones, and price structure shifts — all critical for confluence-based trade planning.
Feel free to check it out — you can use it for free by heading to my profile under the “Scripts” tab.
💡 Educational Insight: How to Trade Wave 5 Liquidity Sweeps
Wave 5 tops often trap late longs, especially when paired with psychological levels and key highs.
➡️ Patience is key — wait for a rejection pattern or SFP before entering.
➡️ Liquidity sweeps first — then the move.
Final Thoughts
PENGU is pushing toward $0.04698–$0.05, but this may be its final move up before correction.
With the yearly open as a logical target, and clear confluence via DriftLine, this setup offers a clean short opportunity — if confirmation comes.
Stay sharp, let price lead, and trade the reaction — not the prediction.
_________________________________
💬 If you found this helpful, drop a like and comment!
Want breakdowns of other charts? Leave your requests below.
PenguCurrent Situation (as depicted in the image):**
* **Asset:** PENGUINSDPERP PERPETUAL MIX CONTRACT (presumably a cryptocurrency perpetual future).
* **Timeframe:** 4D (4-day candles).
* **Your Position:** You are in a short position, and it looks like you are currently in profit, as indicated by "my short with profit."
* **Your Exit/Take Profit:** The blue line marked "SL" (which is typically Stop Loss, but you've indicated it as your "exit") is at approximately $0.017000.
* **Price Action:** The price has recently experienced a significant upward move, currently trading around $0.043089.
* **Moving Averages/Indicators:** There are several lines that appear to be moving averages or similar indicators (green, light blue, dark blue). The fast VWMA is 45, and the slow RMA is 48.
* **Resistance/Supply Zones:** There are red boxes indicating potential resistance or supply zones. One is currently being tested around $0.043-$0.045. Another lower one was previously breached.
* **Support/Demand Zones:** There's a green box indicating a potential support or demand zone around $0.009-$0.010.
**Trading Idea - Managing Your Current Short Position:**
Given that you're already in a short position and in profit, the key is to manage it effectively.
**1. Re-evaluate Your "Exit" (Blue Line at $0.017000):**
* You've stated the blue line at $0.017000 is your "exit." If this is your **Take Profit (TP) target**, it's quite ambitious given the current price of $0.043089. This would imply a very significant drop.
* If this was originally your **Stop Loss (SL)** for a *previous* long trade that you've now flipped to a short, or if it's a stop-loss for *this* short trade but you misspoke, it's very far below the current price and would mean you'd take a huge loss if the price were to rebound from current levels to that point while you're short.
* **Clarification Needed:** Please clarify if the blue line is your Take Profit for the short, or if it's an old stop loss, or something else. For the purpose of this idea, I will assume it's your *intended Take Profit for the short position.*
**2. Adjusting Your Strategy Based on Current Price Action:**
The price is currently challenging a significant resistance zone. This offers a few possibilities for managing your short:
* **Scenario A: Strict Adherence to Original Plan (Risky if $0.017 is TP):**
* If your target is genuinely $0.017000, you are aiming for a massive drop. This is a high-risk, high-reward strategy.
* **Idea:** Hold your short, but **definitely move your stop-loss down to protect your profits.** Do NOT keep your stop loss above the current price if you are short. Place it just above the current resistance zone (e.g., around $0.047000 - $0.050000) to limit potential losses if the price breaks higher.
* **Scenario B: Partial Profit Taking & Trailing Stop Loss (Recommended):**
* Given the significant run-up and the current resistance, it's prudent to secure some profits.
* **Idea:**
1. **Take Partial Profits Now:** Close a portion of your short position (e.g., 25-50%) at the current price levels ($0.043000 - $0.045000). This locks in some profit immediately.
2. **Move Stop Loss (SL) to Break-Even or Above Entry:** For the remaining portion of your short, move your stop-loss to your original entry price (or slightly above it to guarantee some profit, even if the price reverses completely against you). This creates a "risk-free" trade for the remainder of your position.
3. **Set Trailing Stop Loss:** As the price potentially moves lower (in your favor), continuously trail your stop-loss downwards, maintaining a fixed distance (e.g., based on a percentage, ATR, or previous swing highs). This allows you to capture more of the downside while still protecting profits.
4. **Consider Intermediate Take Profit Targets:** Instead of waiting all the way down to $0.017000, consider setting intermediate take-profit targets at key support levels, such as:
* The top of the previous support zone (around $0.012000 - $0.013000).
* The green demand zone (around $0.009000 - $0.010000).
* **Scenario C: Aggressive Short Re-entry/Adding to Short (Higher Risk):**
* If you strongly believe this is a significant top and the price will reverse sharply, you could consider adding to your short position if you see clear bearish confirmation (e.g., rejection from the current resistance, a bearish engulfing candle, or a break below immediate support).
* **Idea:** Wait for a clear bearish reversal pattern on a lower timeframe (e.g., daily or 12-hour) around the current resistance. If it appears, consider adding a small amount to your short. **Crucially, ensure your overall position size remains manageable, and use a tight stop-loss for this additional entry.**
**Important Considerations:**
* **Risk Management:** Always define your maximum acceptable loss per trade.
* **Position Sizing:** Do not over-leverage.
* **Market Context:** What is the broader market sentiment for cryptocurrencies? Are there any fundamental news events that could impact this asset? (The chart itself doesn't provide this, but it's important to consider).
* **Timeframe Alignment:** Your "exit" at $0.017000 is a long-term target on a 4D chart. Be prepared for potentially long holding times and significant volatility if you're aiming for such a large move.
**In summary, the most prudent approach is likely Scenario B: take some partial profits now, secure your remaining position with a tight stop-loss (at least at break-even), and consider trailing it down as the price moves in your favor. Reaching $0.017000 from current levels would be a substantial move, requiring careful management.**

PENGU Breakout Alert: Eyes on 36% Surge to 0.040Hello✌
Let’s analyze PENGU’s upcoming price potential 📈.
BINANCE:PENGUUSDT has broken below its descending channel and quickly shifted into a bullish trend, supported by a noticeable increase in volume 📈. With this breakout structure in place, I’m expecting at least another 36% upside, with the main target around the 0.040 level. Continuation depends on volume sustainability and price holding above key short-term supports 🚀.
✨ Need a little love!
We pour love into every post your support keeps us inspired! 💛 Don’t be shy, we’d love to hear from you on comments. Big thanks , Mad Whale 🐋

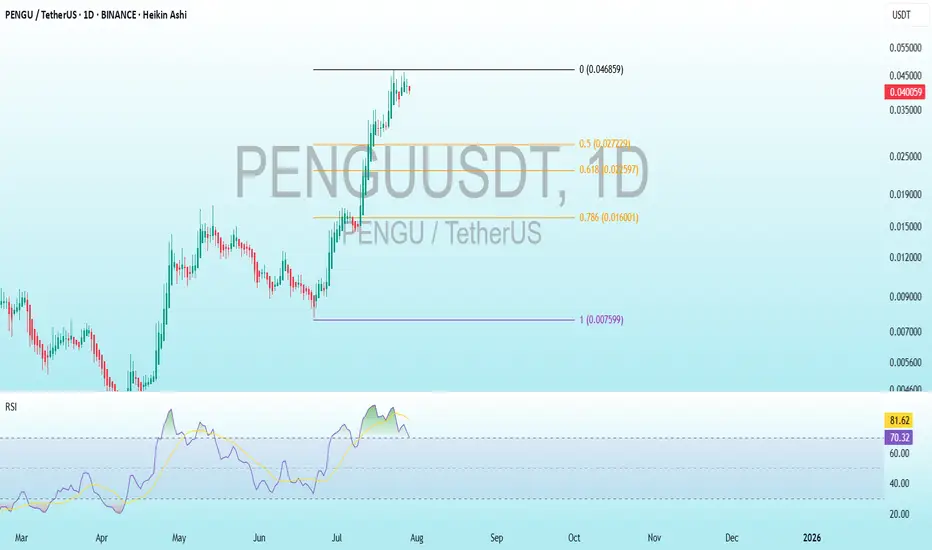
PENGU Bearish DivergenceBINANCE:PENGUUSDT
Support Levels: 0.027229 (recent low, first target for a drop).
0.007599 (deeper support, longer-term target).
Resistance: 0.046859 (recent high, potential stop loss level).
Trade Setup:
Target 1: 0.027229 (short-term, ~25% drop).
Target 2: 0.022597 (mid-term, ~50% drop if bearish trend strengthens).
Target 3: 0.016001 (long-term, ~25% drop).
Stop Loss: 0.007599 (above recent high, ~25% above current price).
RSI Analysis: The RSI shows a bullish divergence (price making lower lows while RSI makes higher lows), suggesting potential upward momentum. Current RSI is around 70.30, nearing overbought territory (>70), so caution is advised.
Buy Trade Strategy for PENGU: Betting on Meme Power and CommunitDescription:
This trading idea highlights PENGU, an emerging meme-based cryptocurrency that has gained popularity through its strong community support and viral potential. Inspired by internet culture, PENGU represents more than just humor — it taps into the growing trend of community-driven tokens that generate momentum through engagement, social media buzz, and grassroots marketing. With a limited supply and increasing visibility across platforms, PENGU positions itself within a niche market where speculation, culture, and community collide.
While meme coins like PENGU can offer explosive short-term potential, they also carry high levels of risk due to their dependence on community sentiment and lack of traditional utility or fundamentals. Market dynamics can shift rapidly, and what gains popularity quickly may also fade just as fast. Therefore, any investment in PENGU should be approached with caution.
Disclaimer:
This trading idea is for educational purposes only and does not constitute financial advice. Investing in cryptocurrencies, especially meme tokens like PENGU, involves significant risk, including the potential loss of all invested capital. Always conduct thorough research, understand the speculative nature of such assets, and consult a financial advisor before making any trading decisions. Past performance is not indicative of future results.
PENGUUSDTGiven the completion of the movement step and reaching the supply range, with a daily close inside the channel, we can have confirmation for the sell position and follow the price to the bottom of the channel.
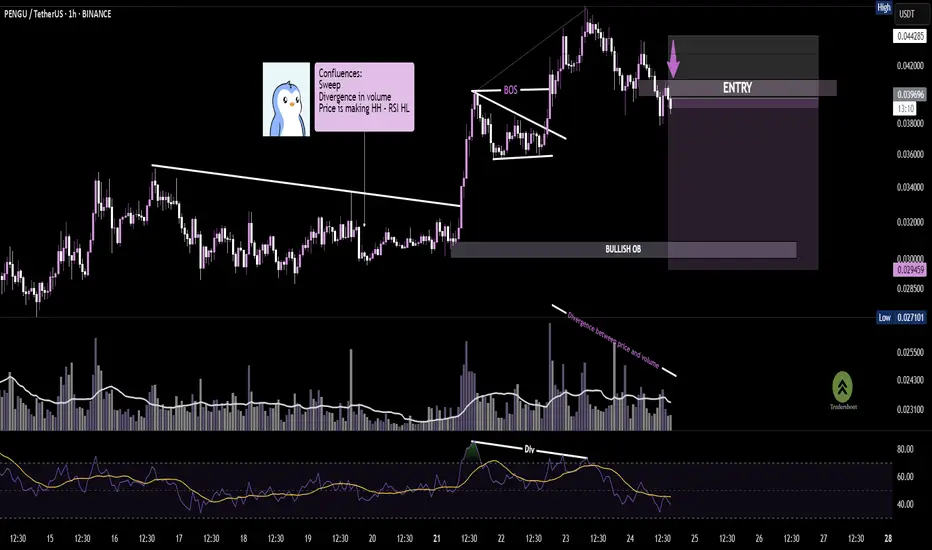
PENGU/USDT - Divergence + OrderBlock = High R Setup📈The setup aligns with a key bullish order block, where price is expected to revisit before a potential continuation.
📉Entry is marked just below current price, anticipating a mitigation of the FVG + OB zone. Multiple confluences (sweep, BOS, RSI & volume divergence) add conviction to this move. If validated, we could see a strong bounce from the OB zone.🧠📉
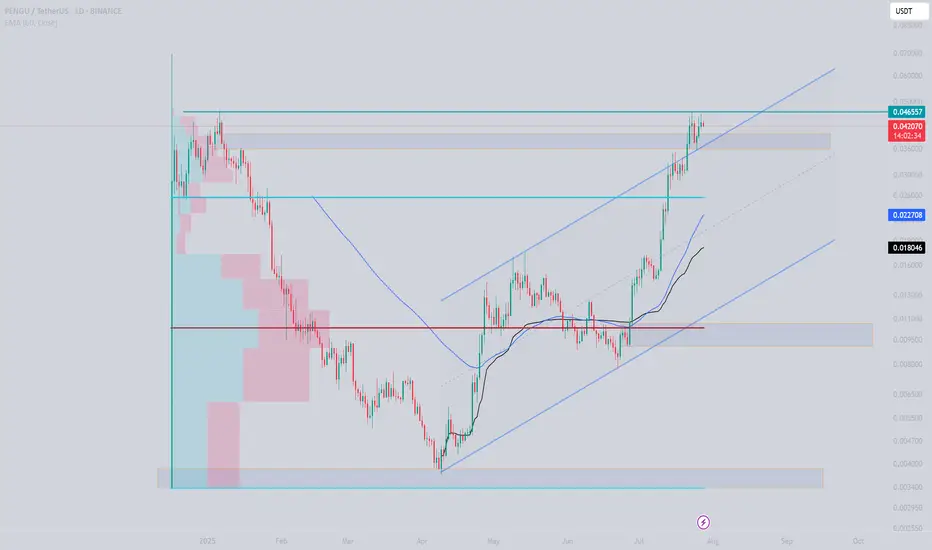
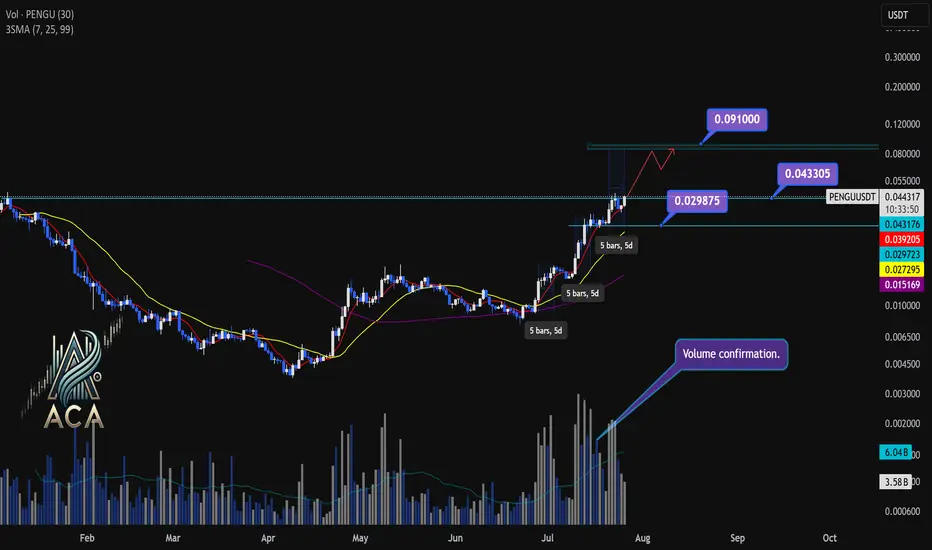
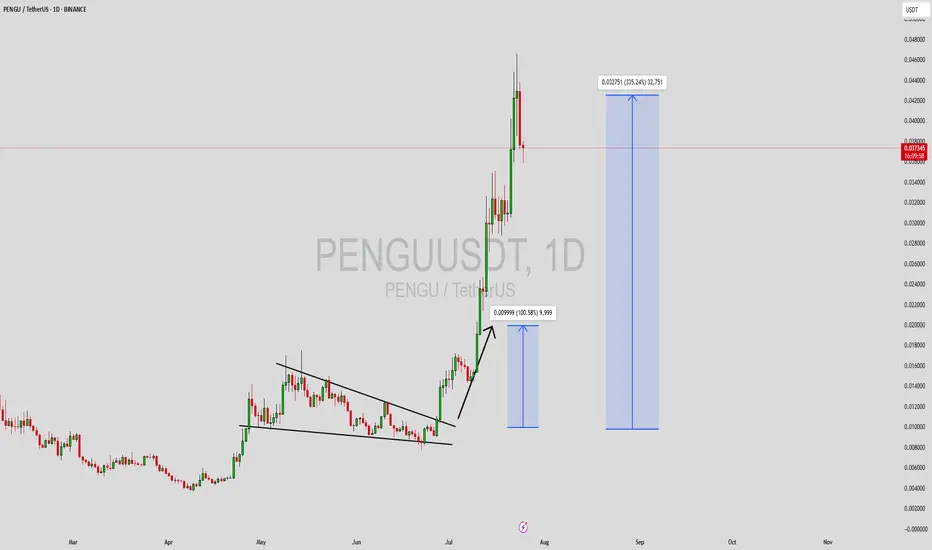
PENGUUSDT Daily Chart Analysis | Powerful Uptrend in PlayPENGUUSDT Daily Chart Analysis | Powerful Uptrend in Play
🔍 Let’s dissect the current PENGU/USDT daily chart, highlighting the unmistakable bullish structure and mapping potential targets as this trend matures.
⏳ Daily Overview
PENGUUSDT is riding a strong upward trend, with all three daily SMAs (7, 25, and 99) lined up in bullish sequence—clear confirmation of momentum. Recent rallies are also supported by textbook volume behavior: volume consistently surges during price climbs and tapers off during minor corrections, reflecting the classic signature of a robust uptrend.
🔺 Bullish Setup and Price Targets:
The next major upside target sits at $0.0910, almost 85% above the current level. For bulls, a daily candle closing above $0.043305 with convincing volume should act as a confirmation for fresh highs—though, as it’s Saturday, even moderate volume could suffice for a valid breakout.
📊 Key Highlights:
- All SMAs (7, 25, 99) confirming the uptrend on daily timeframe.
- Volume spikes on upward moves, fades on corrections—classic bullish confirmation.
- Historical trend velocity: Each time a new high (HH) is set, it’s preceded by around 5 days of advance; first leg was +83%, second +124%, the next (projected) is +160%, aligning with the $0.0910 target.
- Corrections: After each rally, pullbacks have measured about 15% and 20%. Should the first target be reached, expect a correction up to 25%—a healthy reset for further continuation.
🚨 Conclusion:
With all signals aligned—moving averages, volume dynamics, and historic price structure—the path remains bullish. A decisive close above $0.043305, especially with solid volume, could be the catalyst for the next major leg higher. As always, monitor for typical correction ranges post-breakout in line with the prior trend.
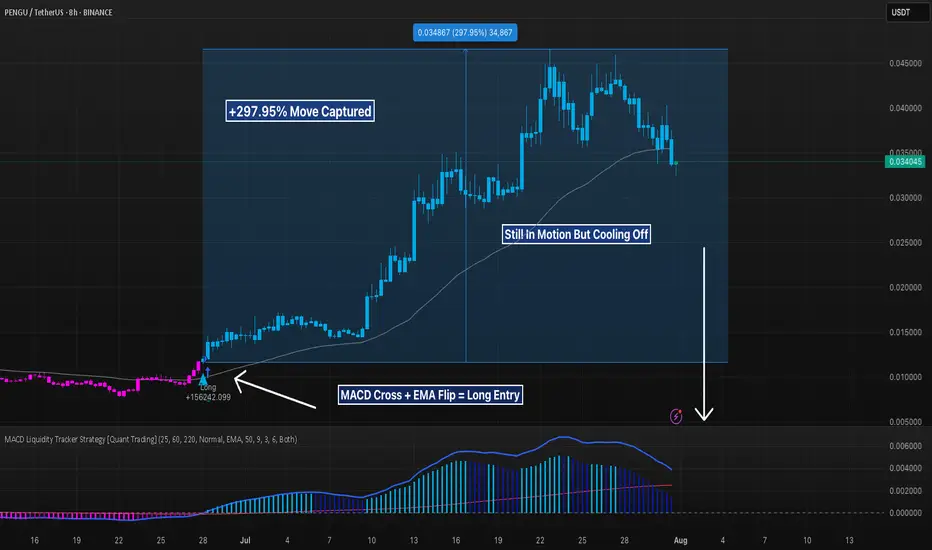
PENGU 8H – 297% MACD Strategy Long Call BreakdownPENGU’s recent move is the kind of textbook trend trade that makes systems like the MACD Liquidity Tracker shine.
The strategy stayed flat throughout the entire sideways grind in June — filtering out chop with its 60/220 EMA trend filter. It wasn’t until late June that MACD flipped bullish and price reclaimed both EMAs. That was the trigger — and from there, it was lift-off.
The system held through a clean +297.95% move from sub-$0.012 to just under $0.045. No early exits. No fakeouts. Just a single, conviction-based trade.
The exit signal hit near the top as momentum waned and MACD rolled over. Since then, price has retraced and is now hovering right above the 60 EMA — a level that's acted as dynamic support all run long.
📊 Strategy Overview:
– MACD Settings: 25 / 60 / 220
– EMA Trend Filter: 60 & 220
– Mode: Normal
– Timeframe: 8H
⚠️ If price holds above the EMA and MACD stabilizes, bulls may still have fuel. But a breakdown below ~$0.029 would shift structure back into bearish territory.
Let the chart tell the story — this was pure momentum trading in action.
#PENGUUSDT confirms a bearish impulse📉 SHORT BYBIT:PENGUUSDT.P from $0.034625
⚡ Stop loss $0.035646
🕒 Timeframe: 4H
⚡ Overview:
➡️ A Double Top pattern BYBIT:PENGUUSDT.P has formed, signaling a bearish reversal.
➡️ The price broke the $0.0355 support and is consolidating below, confirming seller strength.
➡️ Increasing sell volume confirms bearish control.
➡️ Main focus on targets in the $0.034–0.033 zone.
➡️ The POC at $0.03113 remains the ultimate bearish objective.
🎯 TP Targets:
💎 TP 1: $0.033947
💎 TP 2: $0.033369
💎 TP 3: $0.032948
BYBIT:PENGUUSDT.P Trade Recommendations:
📢 Hold short towards the TP zones.
📢 Watch for reaction around $0.0339 — partial profit-taking possible.
📢 Invalidation if price reclaims above $0.0356.
⚠️ As long as bearish pressure holds, the price is likely to continue towards TP2–TP3.
⚠️ A recovery above $0.0356 would invalidate this setup.
🚀 The signal confirms a bearish impulse — expecting further downside!

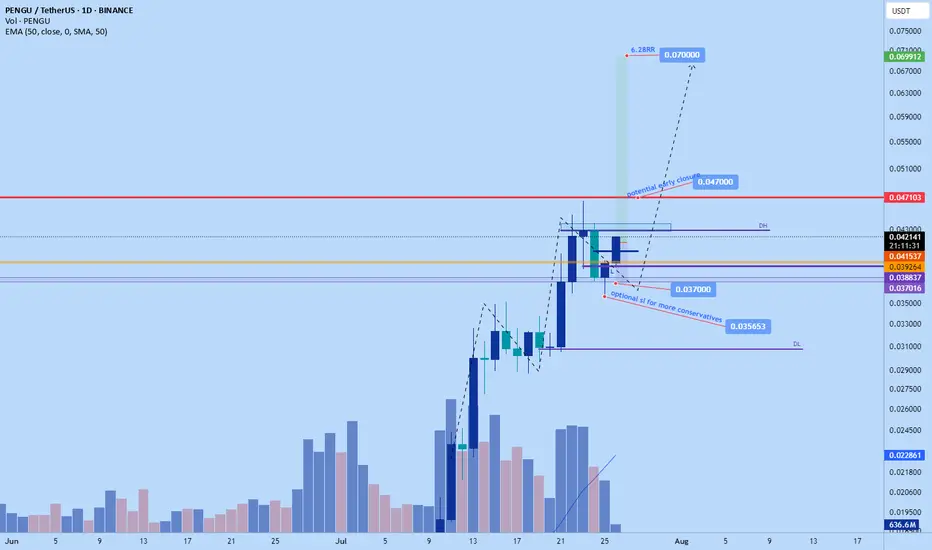
Is $PENGU Cooling Off?CSECY:PENGU continues to deliver, respecting structure and printing some clean price action. After breaking out of consolidation beneath the LOI at 0.032, price extended sharply, reaching as high as 0.0469—where we just saw a firm rejection, previously identified in the last update.
That level wasn’t random. It aligned with a Most Likely Target (MLT) for a wave 5 at a lesser degree and a wave 3 at a higher degree. That kind of confluence usually draws in some heat—and it did.
So what now?
The conservative bull outlook is that we may be entering a wave 4. How this pullback unfolds could tell us a lot. The last retrace was shallow, and if this one digs a bit deeper or breaks certain levels with pattern clarity, that might signal a higher degree wave 4 is underway. The key level here is the 0.0325 level we were watching before.
The raging bull scenario is that we’re still in a lesser degree impulse up. A hold and bounce off the key level could be enough to continue the move higher. But I’m watching the conservative outlook here until we get more print.
Here’s what I’m watching:
• Wave 4 Behavior
Is this a pause or a pivot? The next leg depends on how corrective this gets.
• 0.027
A break here would raise eyebrows. That’s a deeper level of interest and could hint at something more than a minor pullback.
• Pattern Depth & Structure
Each retrace tells a story. More complex wave 4s tend to show themselves through drawn-out corrections or deeper fib targets.
I’m still holding partial from the original 0.012 entry, having taken some profit on the way up. If we get a clean W4 print, I’ll be scouting for the next add.
Trade what’s printed. Stay flexible. Let the wave show its hand.
Trade Safe.
Trade Clarity.

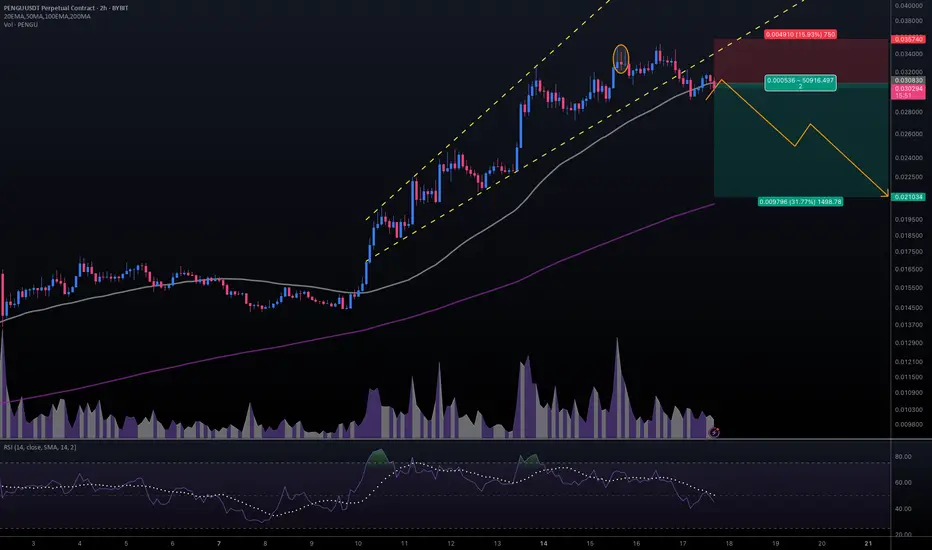
#PENGUUSDT #2h (ByBit) Broadening wedge breakdownPudgy Penguins printed an evening star then lost 50MA, seems to be heading towards 200MA support next.
⚡️⚡️ #PENGU/USDT ⚡️⚡️
Exchanges: ByBit USDT
Signal Type: Regular (Short)
Leverage: Isolated (2.5X)
Amount: 5.0%
Entry Targets:
1) 0.030830
Take-Profit Targets:
1) 0.021034
Stop Targets:
1) 0.035740
Published By: @Zblaba
CSECY:PENGU BYBIT:PENGUUSDT.P #4h #PludgyPenguins #Meme pudgypenguins.com
Risk/Reward= 1:2.0
Expected Profit= +79.4%
Possible Loss= -39.8%
PENGUUSDTPENGUUSDT
Crypto again show strength that's why I'm bullish in PENGUUSDT. It hold good strength to show us upward move. In Crypto, never trade in hurry and always add Qty in layers.
Think about it then make your trade according to your RISK.

PENGUUSDT Forming Falling WedgePENGUUSDT has recently formed a classic falling wedge pattern on the chart—a well-known bullish reversal structure that often precedes explosive upward price movements. As the wedge narrows and consolidates, it typically signals a decline in selling pressure, preparing for a significant breakout. In PENGU's case, this technical setup, paired with increasing volume, points toward a potentially massive upside of 300% to 350% or more, making it one of the most closely watched low-cap altcoins right now.
This crypto project has been attracting fresh investor interest across various social platforms and trading forums, signaling growing awareness and community engagement. The technical pattern aligns with recent shifts in market sentiment, and volume confirmation during the breakout would provide further confidence to traders. Historically, such setups in meme and low-cap community tokens have led to sharp rallies once momentum builds up, particularly when backed by enthusiastic investor sentiment.
Market conditions currently favor altcoin breakouts, and PENGU appears to be positioning itself for a parabolic move. Traders looking for high-risk, high-reward plays may find this pair especially attractive, given the technical clarity and strong accumulation signals seen at current levels. The confluence of pattern breakout, solid volume, and social buzz could create a perfect storm for significant upside.
As always, risk management is key, but the setup offers a compelling technical opportunity worth watching closely in the coming days. A confirmed breakout above resistance could kickstart the rally and attract further retail and speculative flow.
✅ Show your support by hitting the like button and
✅ Leaving a comment below! (What is You opinion about this Coin)
Your feedback and engagement keep me inspired to share more insightful market analysis with you!
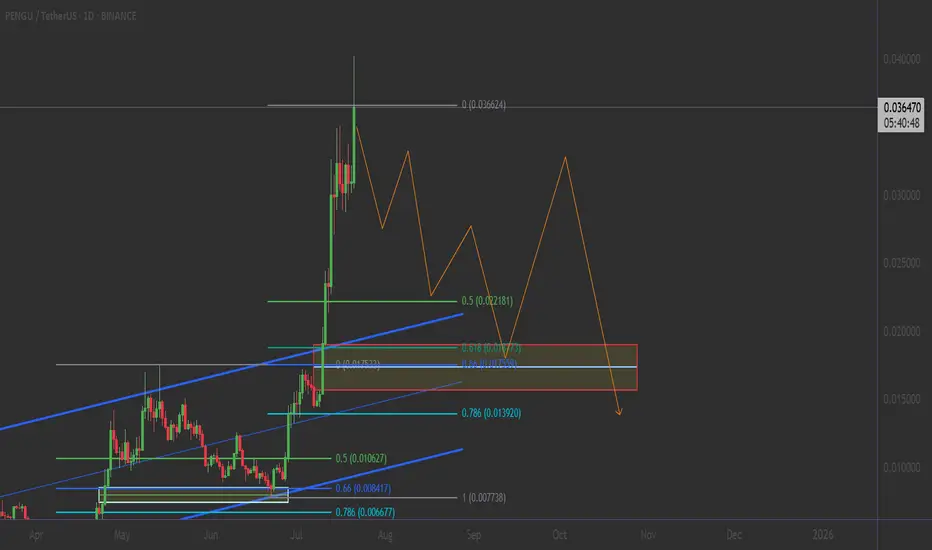
PENGU/USDT: THE ULTIMATE FIBONACCI RETRACEMENT PLAY💎 THE GOLDEN SETUP: 5-Point Technical Confluence
1️⃣ FIBONACCI MASTERCLASS IN ACTION
0.5 Fib Level: $0.021181 (HELD PERFECTLY) ✅
0.618 Golden Ratio: $0.017920 (Strong Support Zone)
0.786 Deep Retracement: $0.013920 (Ultimate Backstop)
Current Position: Trading above 0.5 Fib = BULLISH CONTROL
__________________
❌ BEARISH
Break below $0.029 (Channel support)
Failure to hold 0.5 Fib level ($0.021)
Volume declining on any pullback
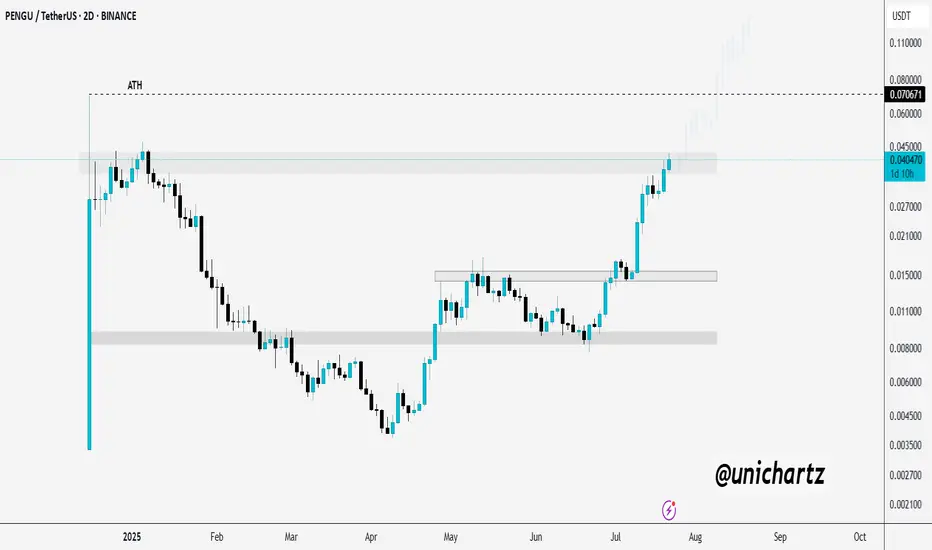
PENGU Approaching Key Breakout Zone – Eyes on ATHCSECY:PENGU is testing a major resistance zone — and it’s heating up! 🔥
If it manages to break and close above this level, we could see a strong rally toward the ATH and beyond.
Keep it on your radar, this move could get explosive.
DYOR, NFA
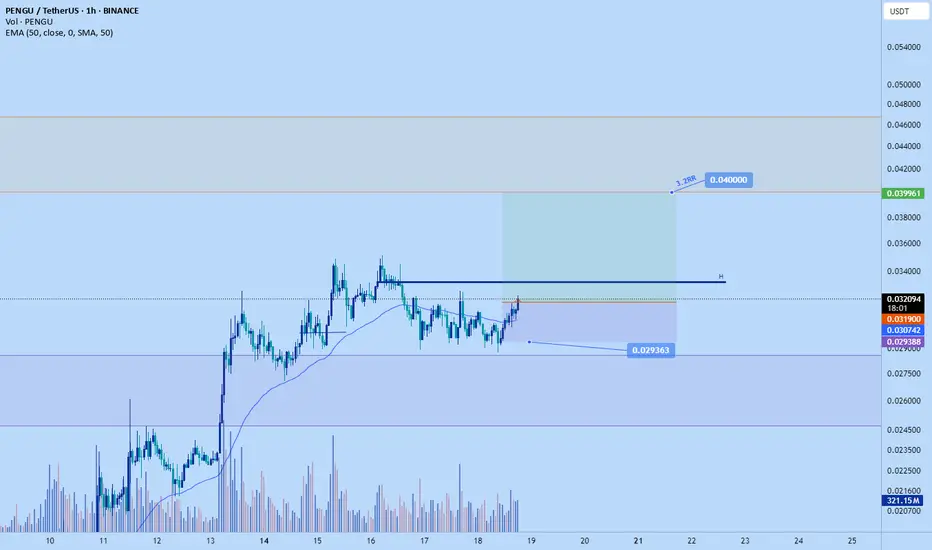
Pengu pump to $0.04 #pengu long.
Stop: $0.029363
tp: $0.04
Pengu is cleaner and likely to hit tp next trading day or tonight