PEPEUSDT.P trade ideas

Sell Opportunity Pepe has been moving within a bearish flag, and now the sell opportunity is almost ripe.
An aggressive trader can entry after a breakout to the downside and hold to 0.00000749.
Or
If you are a conservative trader, wait for a breakout and retest before you enter. Once that happens, enter you sell trades and hold to 0.00000749.
Or


Will PEPE/USDT Reach $0.000011?PEPE coin is showing signs of technical strength amid renewed crypto market optimism. It is currently trading around $0.000009890 with a modest rise of over 1.69% in the past 24 hours but still remains within a tight consolidation range. This hints towards a potential breakout, offering a potential upside of more than 50%.
The PEPE price has been trading within a descending parallel channel but has formed a small ascending parallel channel within
Interestingly, the CMF is dropping while RSI is making every attempt to keep the price elevated, holding the ascending support
This suggests that the strength of the rally is coiling up but the money flow into the platform has decreased
This may place the PEPE price at a crucial juncture as the token is required to break out of the resistance of the main channel to sustain within the ascending trend channel. Hence, the upcoming weekend could have a huge impact on the PEPE price, as a rise above $0.00001 could invalidate the bearish thesis.

Pepe long ideaI like the fact it broke out on all HTF.
Will be adding small position on 4h close.
It did retrace on 4h TF, kind of.
On daily still needs to.
Any ways, last plays were beautifully executed, let us see how it goes on this one.

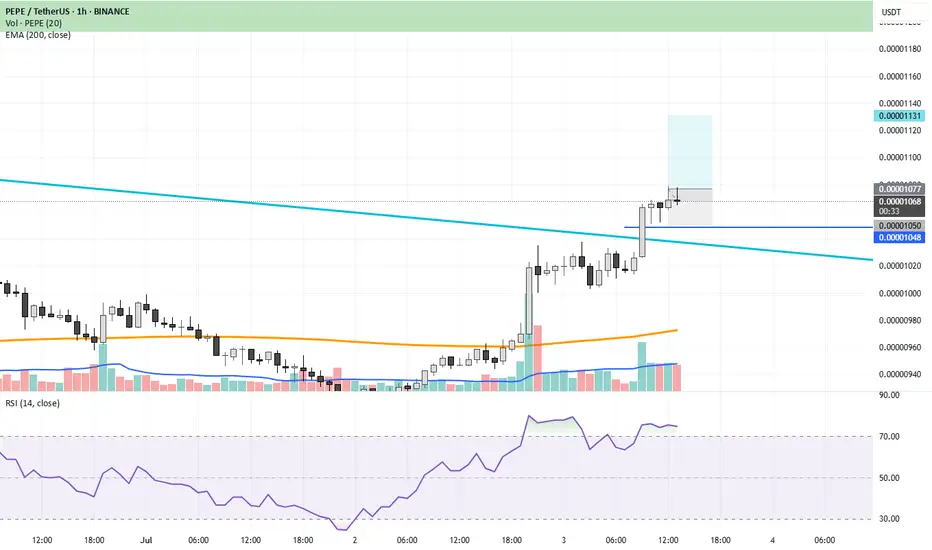
pepe usdtbuy between 0.000105 - 0.0000107
sell 0.000012
SL: 0.00001048
short term profit / Spot trade only
Trading plan for PepeI've marked the new monthly pivot point on the chart for you. I've also outlined potential scenarios based on the higher timeframe analysis and highlighted key trading levels for this week.
Pepe has followed my indicator's local trend perfectly over the last two weeks, increasing the likelihood of an upward move toward the resistance zone without further correction. However, if the local low is breached, the expected rally to resistance would likely be delayed.
Trade safe and stay adaptive!

Lingrid | PEPEUSDT Inverse Head and Shoulder. Bullish Reversal ?BINANCE:PEPEUSDT is forming a potential reversal setup after rebounding from the 0.00000876 support within a well-defined downward channel. Price action shows signs of accumulation with a right shoulder (RS) formation and a potential breakout brewing above the descending blue trendline. A clean push toward the 0.00001125 resistance would confirm the pattern and may trigger further upside toward the red trendline.
📈 Key Levels
Buy zone: 0.00000876–0.00000900
Sell trigger: failure below 0.00000876
Target: 0.00001125
Buy trigger: breakout and retest of 0.00000960–0.00000980
💡 Risks
Strong resistance from downward channel could limit upside
Breakout failure may trap buyers near 0.00000980
Low liquidity increases volatility risk near major levels
If this idea resonates with you or you have your own opinion, traders, hit the comments. I’m excited to read your thoughts!

PEPE is cooking something!⚡️ Hello, everyone! Today I noticed a catastrophic gap: so much time has passed, and I still haven't written about PEPE!
With the emergence of hundreds of thousands of new memecoins, the old ones seem to have disappeared into oblivion. B ut is that really the case, and does PEPE still have a chance? Let's find out!
Having closed all the gaps above and below, PEPE has no further pronounced magnet for movement and is likely now entering a consolidation phase.
🕓 It is worth remembering that the narrative itself is still important in meme coins. And PEPE is an eternal meme, it will live forever, it is literally the embodiment of meme culture in the world. So from this point of view, there is definitely no need to fear the token's oblivion.
⚙️ Metrics and indicators:
Volume - forms a divergence with the price. Throughout the correction, sales volumes continue to decline, signaling the exhaustion of sellers.
Money Flow - harmony with the price. Liquidity continues to decline, positions are being closed. But, in general, the indicator is in the neutral zone.
Support/Resistance - PEPE has now reached the largest zone of interest at 0.00000817 and is trying to consolidate there. This is a powerful level around which consolidation can be expected before further growth. However, if the price falls below it without the possibility of returning, it will be an extremely bearish signal.
Liquidity Depth - As we know, the price moves from one liquidity to another; this is its fuel. And now, there is significantly more of this fuel accumulated at the top. PEPE has always been a highly speculative asset, and during prolonged one-sided movements, extremely high funding is formed in it. This further provokes sharp jumps in price.
📌 Conclusion:
PEPE will definitely not die as a narrative, so there is nothing to worry about. Of course, thousands of new memecoins have stretched liquidity across the market, and many have left PEPE for new shiny things.
But in truly difficult times, when your FARTCOIN and HarryPotterObamaSonicInu are down 90% in a day, many will return to PEPE, especially at such a low price.
According to technical analysis, PEPE is doing much better than DOGE. Flat liquidity inflows, decreasing sales volumes. Those who wanted to leave have already left. And I personally am already starting to look at spot purchases of PEPE at current levels.
🔥 Have a great week, everyone!

Skeptic | PEPE : Spot & Futures Triggers for Maximum EdgeWelcome, traders, its Skeptic! Ready to dissect PEPE’s next moves? I’m diving into a pro-level analysis of PEPE, the #30 crypto and 3rd largest meme coin with a $4.08B market cap. This Analysis delivers a comprehensive breakdown—quick facts, 2025 performance, community strength, and technical triggers for spot and futures trading, all rooted in HWC, MWC, LWC cycles. Trade with no FOMO, no hype, just reason. 🙌 Let’s master PEPE! 🚖
Quick Facts
PEPE, an Ethereum-based meme coin launched in April 2023, is inspired by the Pepe the Frog internet meme. With a 420.69 trillion token supply, it features a deflationary burn mechanism and redistribution rewards for long-term holders. Currently trading at $ 0.00000946 , it ranks as the # 30 cryptocurrency and the 3rd largest meme coin behind Dogecoin and Shiba Inu, with a $ 4.08B market cap. Let’s unpack its 2025 performance and technical setup for actionable trades. 📊
2025 Performance & Community
PEPE has faced significant volatility in 2025, down 25.7% year-to-date and 35% this month. Despite this, its community remains robust with 456,000 + holders, and an impressive 37% haven’t sold in over a year , signaling diamond hands and strong belief in the project. This resilience suggests potential for recovery if market sentiment shifts.
Technical Analysis: Cycle-Based Breakdown
From a cycle perspective, Weekly/Monthly timeframes are range-bound, meaning lower timeframes drive most price action and shape near-term opportunities. Let’s break it down:
Daily Timeframe
After a 100% jump from May 6-22, 2025, PEPE retraced nearly the entire move. Momentum is currently bearish on the Daily, but declining volume during this pullback suggests traders view it as a correction rather than a trend reversal. Interest in heavy trading is low, indicating limited momentum for now.
Key Insight: The Daily is bearish but lacks strong selling pressure, hinting at consolidation. Watch for volume spikes to confirm directional moves.
Triggers for Spot Trading
Long Trigger: Break above resistance at $ 0.00001403 , confirmed by a volume surge during the breakout. For extra confirmation, check PEPE/BTC.
If PEPE/BTC breaks its downtrend line, it signals liquidity inflow and potential for strong growth. The primary trigger is a break of 0.0000000001399 on PEPE/BTC, which could spark explosive rallies for PEPE. Use indicators/oscillators (e.g., RSI) for additional confirmation, as PEPE/BTC volume is fake due to it being a ratio.
Key Insight: A PEPE/BTC breakout is a strong bullish signal, but volume confirmation is critical to avoid fake moves.
4-Hour Timeframe for Futures Triggers
On the 4-hour chart, PEPE has started an uptrend momentum. Should you go long on a break of resistance at $0.00001049? No —the Daily remains bearish, making the first wave risky. First-wave moves against the Daily often face high volatility and fake breakouts, lowering your win rate. Instead:
Long Trigger: Wait for the second uptrend wave after breaking $0.00001049, forming a range ceiling. Confirm with a volume increase, RSI entering overbought, or other oscillators to avoid fake breakouts or stop-loss hunts.
Short Trigger: Break below support at $ 0.00000894 is a strong short trigger, aligning with the bearish Daily. This setup offers favorable R/R ratios, especially if 4-hour momentum turns bearish. Set alarms for this level to catch the move.
Pro Tip: Shorts are safer due to Daily alignment. For longs, skip the first wave, wait for the second, and use tight risk management to navigate volatility.
Final Vibe Check
This PEPE Analysis arms you with precise triggers for spot and futures trading, leveraging cycle-based strategies. With a range-bound Weekly, focus on Daily and 4-hour for opportunities. Short at $0.00000894 aligns with the trend, while longs need second-wave confirmation above $0.00001049 or a PEPE/BTC breakout at 0.0000000001399. Protect your capital—stick to MAX 1%–2% risk per trade. Want more cycle-based setups or another pair? Drop it in the comments! If this analysis sharpened your edge, hit that boost—it fuels my mission! 😊 Stay disciplined, fam! ✌️
💬 Let’s Talk!
Which PEPE trigger are you watching? Share your thoughts in the comments, and let’s crush it together!

$PEPE Holding Support, Eyes on 70% UpsideCRYPTOCAP:PEPE is holding strong at support and forming a bull flag on the 12H chart.
A breakout could send it 70% higher toward 0.000017.
Clean setup, watching closely.
DYOR, NFA.
#PEPE

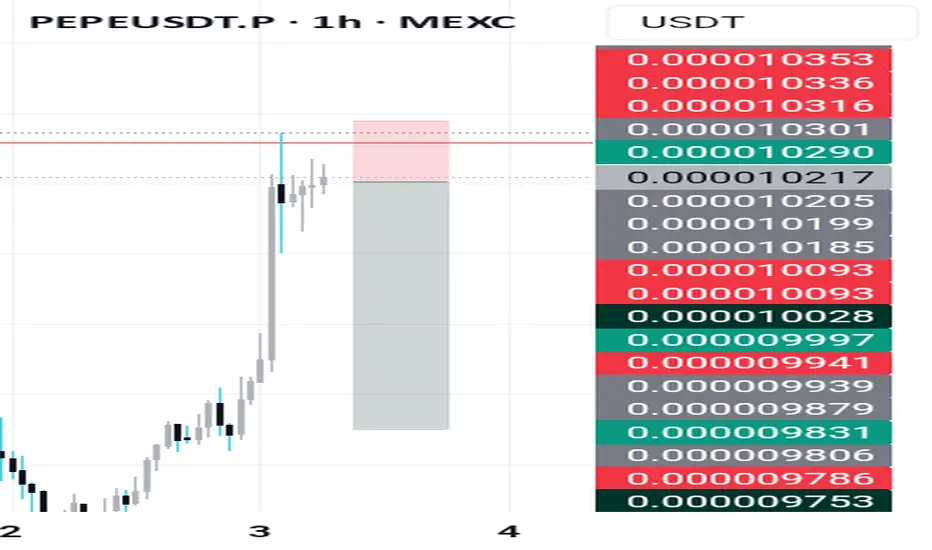
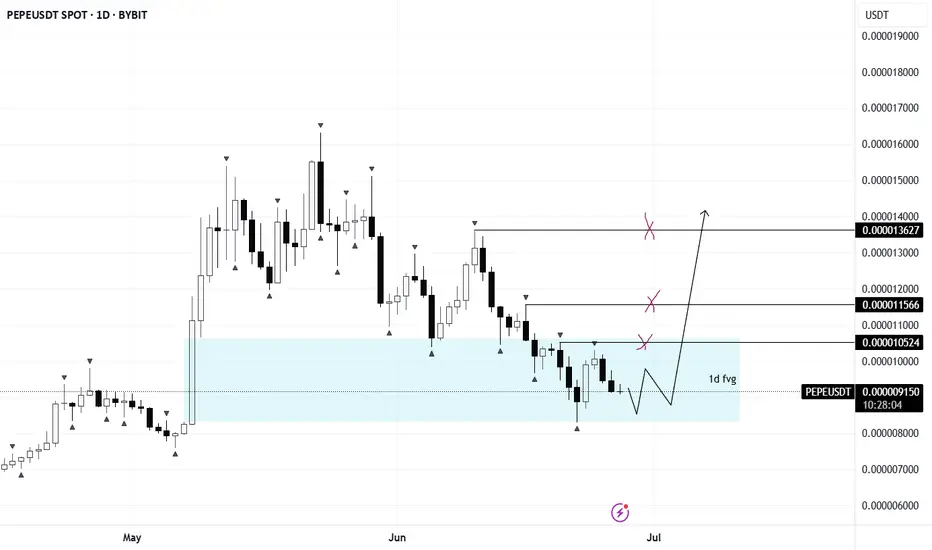
PEPE/USDTDaily FVG has been fully filled. Now watching lower timeframes for long entry conditions.
If confirmed, upside targets sit in the 105–136 range. Let the setup come to you — no entry without clear signals.
Pepe flashing golden cross signal! The overall market is shaky and btc will be a driving factor whether Pepe can pump with bullish momentum. With this said we have flashed a golden cross which is a good indication that momentum could be building. When we mix this with oversold ti on most time frames and a few bullish divergences showing, I feel Pepe could be ab to break out of our falling wedge pattern. Breaking our rsi downtrend on the daily will be a good starting point to gauge further market sentiment. Wait for confirmation.

pepe updateentry price 0.00001425
stop loss update 0.00001425
take profit
0.00001172
0.00001022
0.0000086
result full target

Pepe Prepares To Grow After 5 Weeks Red (5X Possible)I am sorry, the system is not working and won't let me write more than a few lines. This is the best I managed to publish without getting an error.
You can get the idea by looking at the chart and drawings. It points to higher prices in the coming weeks and months. Namaste.

Weekly Trendline Support Respected – PEPE Holding UpOnce again, CRYPTOCAP:PEPE is bouncing off its trusted rising trendline — a level that’s acted like solid ground for months.
Every time price hits this trendline, buyers show up. That’s a strong sign bulls are still in the game. As long as this line holds, the uptrend stays healthy.
Next challenge? That resistance zone above. If PEPE breaks through, we could see another leg higher. But if it loses the trendline, things might cool off toward the next support.


Long trade
📍 Pair: PEPEUSD
📅 Date: Monday, June 23, 2025
🕒 Time: 8:00 AM (NY Session AM)
⏱ Time Frame: 4 Hour
📈 Direction: Buyside
📊 Trade Breakdown:
Metric Value
Entry Price 0.00000912
Profit Level 0.00001046 (+14.69%)
Stop Loss 0.00000866 (−5.04%)
Risk-Reward
Ratio 2.91 : 1
🧠 Context / Trade Notes:
4H Order Block Entry:
The trade took off after a clear bullish order block formed, following a price tap into prior demand with a wick rejection.
Liquidity Grab Below Lows:
Price swept a 4H swing low before reversing, suggesting institutional accumulation below retail stops.

Pepe usdtUpdate
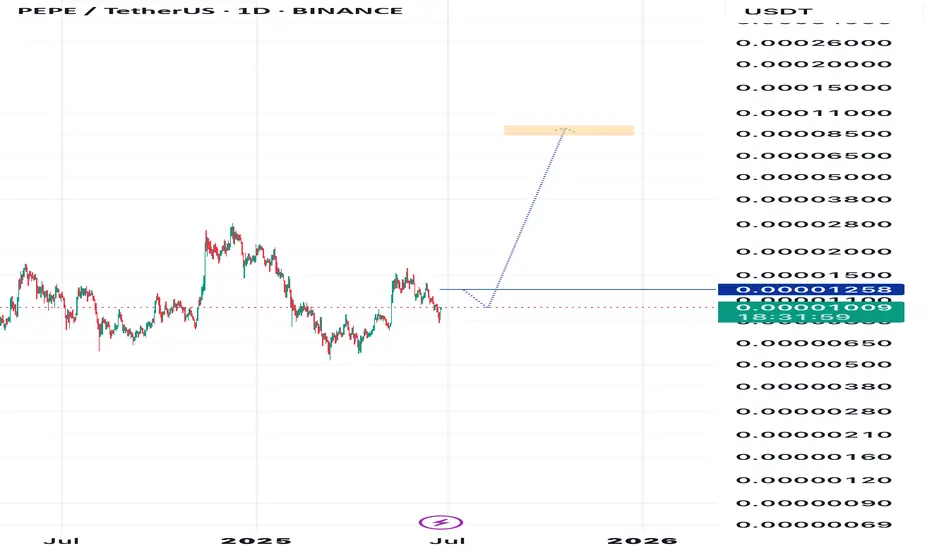
We going to 800% same chart before 2 years if you remember..
Back to old chart for pepe

$PEPE follow up for June 2025Follow-up on my previous CRYPTOCAP:PEPE analysis — it played out exactly as expected.
CRYPTOCAP:PEPE remains my top meme coin, backed by some of the strongest tokenomics in the space. When altseason hits — if it hits — this one is primed to pump hard.
Like most altcoins right now, CRYPTOCAP:PEPE is in a short-term corrective pattern. That opens up another great opportunity to enter low and potentially ride a 2x or 3x move on the next leg up.
I’ve marked my usual buy zone. It may seem optimistic for now, but history shows how fast meme coins can dump… and then recover just as quickly. A drop into that green zone is entirely possible.
📲 Follow me for alerts — I’m monitoring CRYPTOCAP:PEPE daily. It’s one of my top picks.
DYOR.
Here was the previous analysis:
#PEPE #MemeCoin #Altseason #CryptoGems #BuyTheDip #Altcoins #CryptoTrading #Tokenomics #DYOR #CryptoAlerts
PEPE TARGETS FOR 2025🔥 CRYPTOCAP:PEPE long setup (1 D) 🚀 (#1000PEPE )
✅ Entry Zone: 0.0086 – 0.0077 (year-long demand)
🎯 Targets
• TP-1: 0.00220 (Q4-24 supply flip)
• TP-2: 0.00280 (2024 breakdown block)
⛔ Stop-Loss
Daily close < 0.0068
📊 Thesis
• 11.7 T #PEPE scooped by whales in late May 🐋
• #Kraken spot volumes surge; PEPE now a top-10 coin on the exchange 📈
• New “#PEPE Meme” roadmap: P2E mobile game, NFT marketplace & L2 mini-chain 🕹️
• Whole #memecoin sector rotating after #DOGE ETF chatter & ETH ETF approval 📰
• Supply forever capped at 420.69 T; 100 % already in circulation 🟢
• Social reach 3.3 M+ on X, #TikTok campaigns rolling out 🎯
