Minimize Big Losses by Managing your EmotionsHow many times have your emotions taken control in the middle of a trade? Fear, greed, or stress can be a trader’s worst enemy.
This analysis teaches you how to manage your emotions to avoid big losses and look at the crypto market with a more professional eye.
Hello✌
Spend 3 minutes ⏰ reading this educational material.
🎯 Analytical Insight on PEPE :
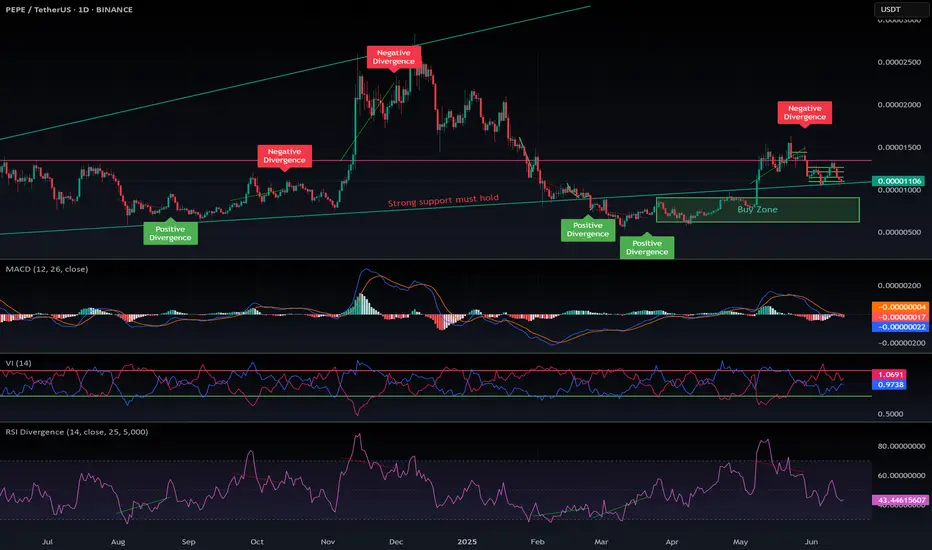
PEPE is testing a strong daily trendline alongside key Fibonacci support, signaling a potential upside of at least 30%, targeting 0.000016 . Keep an eye on this confluence for a solid entry point.
Now , let's dive into the educational section,
💡 Market Psychology and Emotional Management
Crypto markets are highly volatile, which triggers strong emotions in traders. Fear of missing out (FOMO) and greed are two of the biggest enemies of any trader. Without emotional control, it’s easy to fall into bad trades.
The first step in managing emotions is recognizing your behavioral patterns. Once you know when fear or greed kicks in, you can adjust your trading plan accordingly.
Second, stick to a clear trading plan. Whether the market is crashing or pumping hard, stay loyal to your strategy and make decisions based on logic and analysis—not feelings.
🛠 TradingView Tools and Indicators to Manage Emotions
First off, TradingView tools aren’t just for technical analysis—they can help you control emotions and impulses in your trades. One of the best indicators is the Relative Strength Index (RSI), which clearly shows whether the market is overbought (extreme greed) or oversold (extreme fear).
Using RSI, you can spot moments when the market is too emotional—either overly optimistic or fearful—and avoid impulsive decisions. For example, when RSI rises above 70, the market may be too greedy, signaling you to hold back from jumping in hastily.
Besides RSI, indicators like MACD and Bollinger Bands help you better visualize trends and volatility, allowing you to avoid emotional entry or exit points.
The key is to combine these indicators with awareness of market psychology, making them powerful tools to manage your feelings while trading crypto.
📊 Practical Use of Indicators to Avoid Big Losses
Imagine you entered a Bitcoin long position. By watching RSI and MACD, you can pinpoint better entry and exit points.
If RSI is above 70 and MACD shows a reversal signal, a price correction is likely. In such cases, trade cautiously or consider exiting to avoid significant losses.
Additionally, setting stop-loss orders based on support/resistance levels identified by Bollinger Bands is another key risk management strategy. This keeps your losses controlled and within acceptable limits, even if the price moves suddenly.
⚡️ The Psychology of Loss and Greed — Two Big Trader Traps
After losing, it’s natural to want to recover quickly, but that’s where greed often leads to risky, poorly thought-out trades. To break this harmful cycle:
Focus on the size of your losses, not just your profits
Take a break from trading after a loss to calm your emotions
Use TradingView tools for thorough analysis and never let feelings drive your decisions
🔍 Final Advice
Managing emotions is the backbone of successful trading in highly volatile crypto markets. Smart use of technical indicators like RSI, MACD, and Bollinger Bands, combined with self-awareness and strict adherence to your trading plan, can drastically reduce big losses and maximize gains. Always remember to view the market through a logical lens, not an emotional one.
✨ Need a little love!
We put so much love and time into bringing you useful content & your support truly keeps us going. don’t be shy—drop a comment below. We’d love to hear from you! 💛
Big thanks,
Mad Whale 🐋
📜Please remember to do your own research before making any investment decisions. Also, don’t forget to check the disclaimer at the bottom of each post for more details.
PEPEUSDT trade ideas

Short trade Pair: PEPEUSDT
Trade Type: Sell-side trade
Date: Saturday, 14th June 2025
Time: 6:30 AM
Session: London to New York Session AM
Entry Timeframe: 15min
📍 Trade Details
Entry Price: 0.00001111
Profit Level: 0.00001064 (4.23%)
Stop Level: 0.00001121 (0.90%)
Risk-to-Reward Ratio (RR): 4.70
🧠 Context / Trade note: Sell-side trade idea
Trade positioned during the London to NY session overlap, a high-volume window with strong directional momentum. Observed volume imbalance as price pushed into a minor supply zone — signs of liquidity sweep and exhaustion.
15min TF entry

Pepe Short ResultPrice was in a strong bearish trend, even after the breakdown, price consolidated in a bear flag also under the major bearish trendline, which are all indicators of further breakdown.

Lingrid | PEPEUSDT buying Opportunity from Support ZoneBINANCE:PEPEUSDT has extended its decline within the broader downtrend, recently forming a new local lower low at the support zone around 0.000000947. Price action is now testing the lower boundary of the descending channel and support level with potential for a short-term bounce. A break above the 0.00000102–0.00000107 resistance cluster could ignite a rally back toward the key trendline and upper range near 0.00000117.
📈 Key Levels
Buy zone: 0.00000094–0.00000100
Sell trigger: loss of 0.00000094 support
Target: 0.00000117
Buy trigger: bullish breakout above 0.00000105 with volume
💡 Risks
Rejection from the trendline may push price into new lows
Continuation of lower lows signals trend pressure
Weak volume may stall breakout above 0.00000105
Traders, if you liked this idea or if you have your own opinion about it, write in the comments. I will be glad 👩💻

#PEPEUSDT: Major Swing Upcoming! Get Ready! PEPEUSDT is currently in phase two of accumulation and will distribute the price soon. We expect the price to move in a bullish impulse pattern as we anticipate volatility in the coming days. However, we advise having a secondary bias while investing or trading on cryptocurrency, as it is highly risky and lacks the same volume as forex or gold.
Good luck and trade safely!
Team Setupsfx_

PEPE Drops -8.09% — Point of Control Becomes Key BattlegroundPEPE has posted a sharp -8.09% daily correction, confirming a new lower low in the ongoing downtrend. Price action remains bearish after rejecting from the value area high, where it tapped into the 0.618 Fibonacci retracement and failed to break higher.
This rejection triggered a rotation back toward the point of control (POC), which now acts as the next major support level. The POC is in confluence with the 0.786 Fibonacci retracement and a monthly high-timeframe level, forming a strong zone of interest for both bulls and bears.
According to market profile theory, losing the value area high increases the likelihood of a full rotation to the value area low — and that’s now on the table if the POC fails to hold.
If price stabilizes and demand appears at the current level, we could see a short-term bounce or even a structure shift. However, if price breaks below the POC, a deeper correction becomes the more probable outcome.
Key Levels:
Resistance: 0.618 Fib / Value Area High
Support: Point of Control / 0.786 Fib
Bearish Bias until structure shifts

Pepe update hello friends✋️
Considering the drop we had, you can see that the price was well supported in the specified area and buyers came in. Now in the return of the price, we can buy step by step in the specified support areas and move with it until the specified goals, of course, with the management of shame and risk...
*Trade safely with us*

Pepe Support Confirmed, Bullish Continuation Next (Trade & Win)Support is now confirmed with four green days after EMA55 and EMA89 hold as support. PEPEUSDT is bullish now and set to grow.
The peak happened 24-May. The low 5-June.
This retrace lasted 13 days with a total drop of 36%. For future reference.
After each bullish wave, there is always a retrace or correction. In this case only a retrace because the bullish cycle is just getting started, the previous wave of growth was very small.
The next advance will be very, very strong so we can expect a correction after it. The difference between the retrace and a correction is about size. The correction lasts longer and goes deeper, that's all there is.
Expect maximum growth now but this won't be the end. It will grow super strong in the coming weeks and months, then we get a correction and then even more growth. But the fifth wave is the last one, after this we get a bear market so pay attention.
Pepe's support has been confirmed. This bullish continuation will turn the market full green.
Follow me to trade with me and win.
Namaste.

Pepe, Finding The Next Support ZoneThe same analysis that I made for Dogecoin is true here on PEPEUSDT.
We have two support zones. We have lower highs long-term, starting December 2024 (six months is already long-term), and short-term, June vs May.
What we are seeing is a repeat of the December correction but a miniature version. The bullish wave that follows will be a repeat of the April-May advance but with total growth highly magnified.
So the correction will end up being much smaller while the bullish wave that follows much stronger. Alternation.
If you want more information on price action, what is happening, read all the recent charts I just published. The situation across several projects is quite similar, at least the ones I've been seeing.
The duration of the correction will vary between a few days to a few weeks. Some pairs are already at bottom and will recover soon while others still have a long way to go. Those that grew nicely recently will remain lower, those that didn't grow will move up strong first.
Each chart needs to be considered individually but that's the general picture. You can find which ones will move first on the next wave based on recent past action.
Thank you for reading.
Namaste.

Most see capitulation. I see clean premium-to-discount deliveryPEPE just swept deep into the 0.786 retracement — right where most fear sets in. But Smart Money? This is where they reaccumulate. The structure isn't broken — it's resetting.
Here’s what the chart tells me:
Price dipped straight into the FVG + 0.786 (0.00000945) zone
That's the deepest discount before structural invalidation — exactly where Smart Money looks for reversal footprints
The upside draw sits cleanly at 0.00001194 (0.5 fib), with an extension possible toward 0.00001297 and even 0.00001424
This move down didn’t violate anything. It rebalanced prior inefficiency and opened the door for premium delivery.
Execution logic:
Accumulate within 0.00000945–0.00000918 (discount zone)
Invalidation: break below 0.00000758 closes the book on this setup
Targets: 0.00001194 → 0.00001297 → 0.00001424
The biggest moves don’t start when it feels safe. They start when it feels late.
For setups like this — built on logic, not luck — check the profile description. I trade where Smart Money trades.

$PEPE follow up for June 2025Follow-up on my previous CRYPTOCAP:PEPE analysis — it played out exactly as expected.
CRYPTOCAP:PEPE remains my top meme coin, backed by some of the strongest tokenomics in the space. When altseason hits — if it hits — this one is primed to pump hard.
Like most altcoins right now, CRYPTOCAP:PEPE is in a short-term corrective pattern. That opens up another great opportunity to enter low and potentially ride a 2x or 3x move on the next leg up.
I’ve marked my usual buy zone. It may seem optimistic for now, but history shows how fast meme coins can dump… and then recover just as quickly. A drop into that green zone is entirely possible.
📲 Follow me for alerts — I’m monitoring CRYPTOCAP:PEPE daily. It’s one of my top picks.
DYOR.
Here was the previous analysis:
#PEPE #MemeCoin #Altseason #CryptoGems #BuyTheDip #Altcoins #CryptoTrading #Tokenomics #DYOR #CryptoAlerts
Long trade
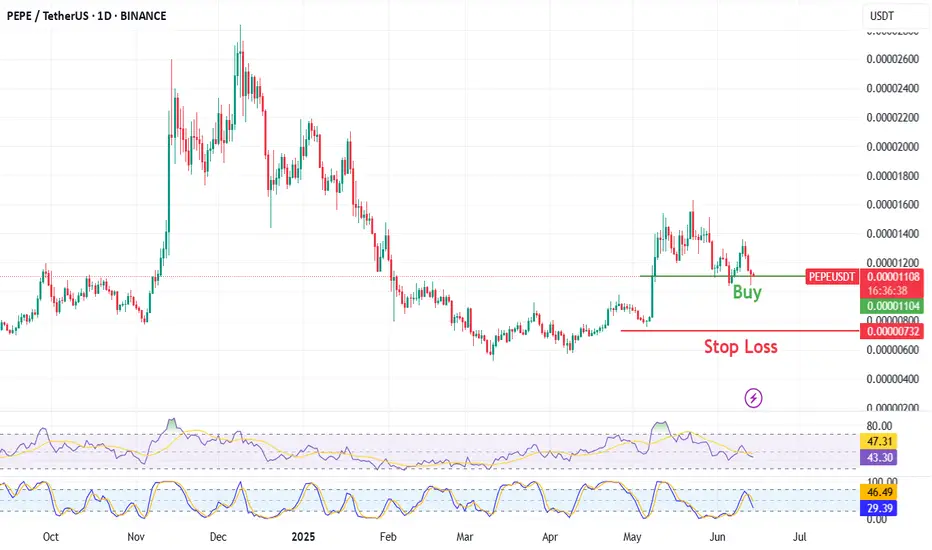
🟢 PEPEUSDT – Buyside Trade
Date: Sunday, 15th June 2025
Session: Asia Session AM
Time: 6:15 AM
Entry Timeframe: Short-term (scalp entry)
Trade Parameters
Entry: 0.00001112
Take Profit: 0.00001158 (+4.14%)
Stop Loss: 0.00001101 (−0.99%)
Risk-Reward Ratio (RR): 4.18
🧠 Trade Reasoning
Price action on PEPEUSDT was consolidating within a tight range following a liquidity sweep beneath the 0.00001100 handle. Entry was taken after observing bullish confirmation at a micro demand zone, with the price reclaiming a short-term range low.

PEPE/USDTPEPE/USDT is looks good for buy it is showing retracement on daily chart and the 4hr chart also showing a good bullish divergence
$PEPE looks ready to leap again!CRYPTOCAP:PEPE looks ready to leap again! 🐸
After its massive December 2024 rally, CRYPTOCAP:PEPE has undergone an equally strong correction — but signs suggest the bottom is in.
✅ Strong support at 0.0000700 and 0.0000650
✅ MACD stabilizing
✅ RSI showing a huge bullish divergence
Momentum is building — don’t lose sight of the frog! 🐸🚀
DYOR
#PEPE #Altcoins #CryptoTrading #BullishSetup #RSIDivergence #MemeCoinSeason #CryptoAlert #PEPEArmy
Compression, rejection, and the trap belowPEPE isn’t random here — it’s in a calculated drawdown. Not a dump — a design. What looks like weakness is really compression into a reactive pocket.
The logic:
Price is descending inside a compression channel. But the real interest lies lower — specifically around the FVG and the untouched demand range down to 0.0000089. That’s the key.
The 0.0000103 zone is a surface-level fib level (0.382), but the deeper intention is beneath it — where Smart Money will want to accumulate before running it back into inefficiency.
Above us? There’s a massive void sitting between 0.0000115 and 0.0000126. That’s the draw — but not before a deeper sweep to fuel it.
Two key paths:
Ideal: Full sweep of 0.0000089 demand → strong reversal → drive back into the .5/.618 fib cluster near 0.0000115–0.0000126
If front-run: Hold near current level (0.0000103) and deliver into the FVG gap above
Anything below 0.0000083? That’s your invalidation. Until then, compression is the setup.
Final thought:
“Smart Money doesn’t chase the wick. It sets the trap — then steps in with size.”

PEPE in a Weekly Timeframe.Today, let's discuss PEPE using the weekly timeframe chart.
PEPE has formed a bullish pattern, with the price showing a rebound from the support trendline. This rebound was crucial for PEPE to initiate a bullish move. With that being said, the current price is holding above the 21 EMA, which is a positive sign.
If everything plays out well, a 300% move may not be far off.
The strategy will be simple:
~ Entry: $0.000009 to CMP.
~ Trade type: Spot.
~ Trading period: Till August 2025.
~ Target: $0.000045.
Note: Always do your own research and analysis before investing.

Not a huge pump like previous time But a simple 150% gain onlyWe are looking for a more gain and pump here too like other spot coins and i am bullish now on Crypto for sure because Bitcoin can also soon hit new ATH.
And on this market at least +150% pump is also expected for one of the major MEMEcoins like PEPE.
DISCLAIMER: ((trade based on your own decision))
<<press like👍 if you enjoy💚

PEPE 4HPepe seems to have broken the downtrend and is coming to get approval. 0.0000145-1500 regions may come as targets.

$PEPE Analysis 📊 CRYPTOCAP:PEPE Analysis 📊
#PEPE eyeing that trendline liquidity 👀 — waiting for a sweep followed by a tap into the 1H FVG to trigger a long entry 🎯
Let the liquidity hunt finish — then ride the bounce 🐸📈

pepe Updateentry price 0.00001425
stop loss update 0.00001425
take profit
0.00001172
0.00001022
0.0000086
result 1 target and risk free

PEPE - Last bullish wave PEPE is reaching a solid level presented in green rectangle.
I believe this level will attract investors for the following reasons :
Technicals :
PEPE reached a solid support level presented in green line.
Price action :
- Recent correction of -35% wich is very high compared to the BTC correction.
Beyond technicals :
- Very strong community
- Meme coin had it's bullish time and reached very high fomo levels. I think the next bullish wave will be limited to the red box I present in the chart.
Market sentiment :
The investors will dump their coins as well as the bullish move will come. The are now sitting on enormous amount of profits.
Recap :
- Risks : bad news , whales dumping , ...
- Main Target : +71%

PEPEUSD going to moon according to my analysis. {08/june/2025}Educational Analysis says that PEPEUSD may give trend Trading opportunities from this range, according to my technical analysis.
Broker - binance
So, my analysis is based on a top-down approach from weekly to trend range to internal trend range.
So my analysis comprises of two structures: 1) Break of structure on weekly range and 2) Trading Range to fill the remaining fair value gap
Let's see what this pair brings to the table for us in the future.
Please check the comment section to see how this turned out.
DISCLAIMER:-
This is not an entry signal. THIS IS FOR EDUCATIONAL PURPOSES ONLY.
I HAVE NO CONCERNS WITH YOUR PROFIT OR LOSS,
Happy Trading, Fx Dollars.

Short on pepeusdtWe reach a supply zone and then we have a impulse and continuation pattern and we enter....
