PEPEUSDT CHART ANALYSİS - EDUCATIONAL POSTThe NFT Concept
You may already know that each unit of value in a blockchain is called a token. In an open blockchain, all tokens are equal and interchangeable. For example, one bitcoin can be easily replaced with another, and nothing will change.
Non-fungible tokens are a game-changer, which work differently. An NFT is a digital asset that cannot be replaced with another token without changing the value and basis of the object.
Like cryptocurrency, NFTs are created on a blockchain, which acts as a database to record all transactions. The blockchain guarantees the uniqueness, safety, and anonymity of non-fungible tokens. Thanks to this system, any user can verify the originality and transparency of the history of a particular NFT through the blockchain.
When you buy an NFT token, you are obtaining a certificate for a digital or real object. However, the work itself doesn’t move anywhere. You only use its digitized file or a certificate of ownership. Once created or purchased, the token sits in perpetual storage. This certificate is just lines of code that confirm it is the token owner who has the original copy of the object.
An NFT token can be compared to a painting, which may belong to a gallery, museum, or individual, but the audience can see it in a catalog or exhibition.
NFT tokens are sold in online marketplaces that operate like Amazon. The creators put them on marketplaces and wait for bids from buyers.
An NFT token can be created by you or by anyone for that matter. To do this, you need to take a digital object (picture, music, photo, etc.), register in a particular marketplace on a platform such as Rarible or OpenSea, and upload the object with a description and price. You will have to pay a fee for creating a blockchain entry on many platforms. However, the costs pay off in most cases, as NFTs are #1 in the crypto world today.
PEPEUSDT trade ideas

PEPE, my notes for long-termThe price has fallen to the lowest point it can fall, if these levels are lost we can say that the upward movement will not continue. There does not seem to be a problem in the long term for now. The price may go up and down between the levels of .08 and 0.11 for a while. The first target for closing above 0.11 is .21; this is important. If .21 is not passed, a new ATH cannot be expected, the price may even come back to its current levels again. When the .21 0.618 fib level is passed, I expect Pepe to make a new ATH and also reach the flag target level of .41 dollar
In a nutshell; important levels .08 - .11 - .21 - .28 - .41
Not investment advice.

PEPE/USDT Breakout Watch: Key Level to Trigger a Bullish SurgeKey Level Analysis
The phrase "if the price closes above this level then" suggests a confirmation level that must be broken for an upward move.
The highlighted level seems to be an area of previous support-turned-resistance (around 0.00001150 - 0.00001200 USDT).
If the price closes above this level on the weekly timeframe, it signals:
Breakout confirmation → Likely leading to a strong bullish rally.
Trend reversal → A shift from bearish to bullish structure.
Momentum entry point → A trigger for potential buy positions.
Potential Price Movement
If the weekly close is above the key level:
The price could rally significantly (illustrated by the large blue arrow).
Next resistance levels could be around 0.00001700 - 0.00002200 USDT.
If the price fails to close above the level:
It could mean a continuation of the downtrend.
Retesting lower support areas around 0.00000650 - 0.00000550 USDT.

Pepe large time frame PoC 1 March 2025Fixed Range Volume Profile from Sunday 3 November 2024 1am. At the moment we're at the VaL (Value Area Low) BUT resistance at the PoC (Point of Control).
Having said that, this is on a 12 hour chart. Momentumm looks weak. Trade cautiously.
Zoom out for all Volume Profiles that I'm using.
By low, sell high is what they say. In this case were at a low.
This idea correlated with the recent ideas:
and:

Will PEPE Hold 686 Support and Rebound to 1234?
The BINANCE:PEPEUSDT CRYPTO:PEPEUSD chart is approaching a key support level at 686, an area where price has previously reacted with strong bullish momentum. The current structure suggests that buyers might step in again at this zone, making it a potential area of interest for long entries.
The Stochastic Oscillator is signaling an oversold condition, with a bullish crossover forming. This indicates that selling pressure may be weakening, increasing the probability of a reversal. If the price finds support at 686, a long position with a stop-loss below this level presents an attractive risk-to-reward ratio targeting the 1234 resistance level.
For additional confirmation, traders could wait for a break of a recent swing high to signal momentum shifting in favor of buyers. Another approach is to monitor lower timeframes for market structure reversals once the price reaches 686, ensuring a more refined entry.
👨🏻💻💭 Will PEPE bounce from 686 again and target 1234, or will sellers take control? Let me know your thoughts below!
__
The information and publications within the 3Commas TradingView account are not meant to be and do not constitute financial, investment, trading, or other types of advice or recommendations supplied or endorsed by 3Commas and any of the parties acting on behalf of 3Commas, including its employees, contractors, ambassadors, etc.

PEPEUSDTRisk warning, disclaimer: the above is a personal market judgment based on published information and historical chart data on Tradingview, all analysis is only subjective. Hope investors consider, that I am not responsible for your investment decision.
Thank you.
Good luck

PEPE USDT🚀 #PEPE
CRYPTOCAP:PEPE is testing a strong support zone, aligning with the trendline and previous breakout level. This could be a high-reward entry point before the next bullish wave 📈🔥.
Failure to hold support could lead to a retest of 0.00000756, but overall structure suggests a potential massive rally ahead 🚀🐸.
🎯 Target : 0.00002761 (+330%)

PEPE is absolutely on down trend.This is just an Trend and Support & Demand analysis. DO YOUR OWN RESEARCH...
Look at the market from the perspective of the war between buyers and sellers and the aim of making a profit. From this perspective, just think about how right the buyers were to sell after they bought (invested) at the bottom and earned 46 times after it was listed on Binance.

PEPEUSDT: A Massive Move Incoming?Yello, Paradisers! Is PEPEUSDT gearing up for a breakout, or will it crumble under pressure? Let's break it down.
💎PEPEUSDT has formed an ending diagonal with a clear 5-wave structure and bullish divergence, increasing the probability of an upcoming bullish move. But here's the catch—it all depends on key levels and volume confirmation.
💎If PEPEUSDT breaks out and closes a candle above resistance with strong volume, it will signal strength and increase the likelihood of a continued bullish push.
💎If price consolidates with weak volume, it’s better to stay on the sidelines—especially with the broader crypto market looking bearish for now. No need to force trades.
💎However, If PEPEUSDT breaks down and closes below the support zone, it completely invalidates the bullish setup. In this case, stepping aside is the best move.
🎖 Discipline and patience always win in this market, Paradisers. If the market gives confirmation, we strike. If not, we wait. Trade smart!
MyCryptoParadise
iFeel the success 🌴

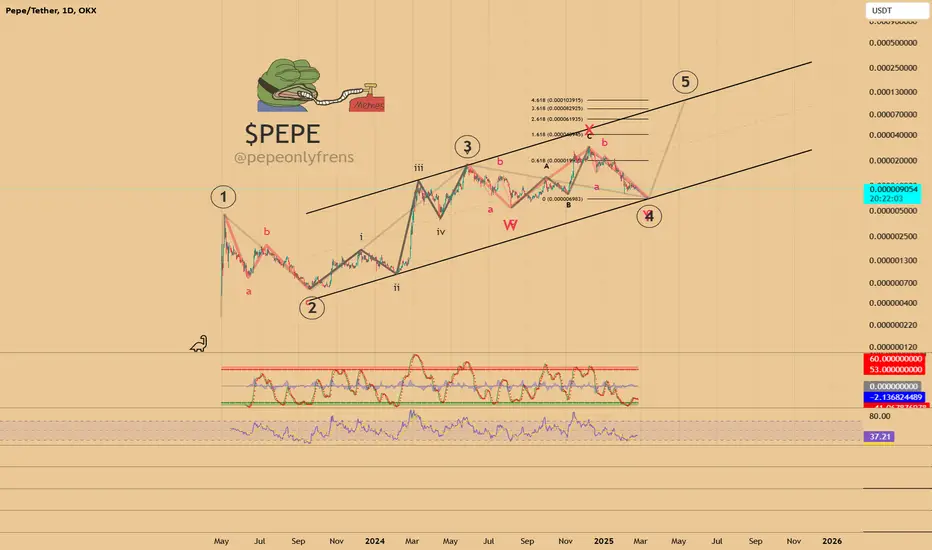
PEPE (Y25.P1.E1). Top is done. Hi Traders,
Diagonal wave 5 confirmed in my opinion. From a wyckoff perspective, I see this as distribution with wave 2 to 3 in progress.
The neckline is clear, the grinding support line has been compromised so refer to the wyckoff models for the last stages before it drops.
Hence I'm looking for a nice spot to short.
The indicator might help a little to find an entry for a long or short in the coming days or weeks.
All the best,
S.SAri

Market Update: Caution on $PEPEMarket Update: Caution on CRYPTOCAP:PEPE
There was hope. The consolidation looked exhausted, and a daily pump was forming.
Then Bybit got hacked , Bitcoin dumped, and now everything seems canceled.
⚠️ Warning: CRYPTOCAP:PEPE , despite being a solid and well-managed meme coin, is still a meme. Institutions appear to be selling off anything that looks like an animal in crypto.
What to Do Now?
✅ Wait for market stabilization— CRYPTOCAP:PEPE is at an attractive price, but it can drop much lower.
✅ Refill your bag at the bottom of the correction, not during dead cat bounces —unless you're a pro at trading bearish markets.
The Reversal Will Be EPIC! 🚀
This is temporary. Once the market bottoms out, the bounce could be massive. CRYPTOCAP:PEPE can do x2 or x3 in a month when sentiment improves!
🔍 DYOR

Pepe Butterfly Gartley Update - Daily Fib Resistance LevelsHey guys, Pepe Butterfly Gartley just hit the target low at (D).
Although a bullish gartley, we still have to make sure we dont lose the lowest low just put in. That would invalidate the pattern.
Fibs - bright numbers on the right are all valid resistance levels up until 0.618 to see lower! Would be good to clear 0.618 and monthly resistance for some strength in the uptrend.
Usually this pattern is bullish in terms that the price will retrace (up) to point A.
Down trend, given the big picture. We still may be in a downtrend to fulfill Wave 5!
At the moment very strong down trend, trade with caution as don't be only bullish. Look for rejections at 0.236, 0.5, and 0.618. Opening times more significant from now 1 hour 15 minutes time.

Pepe Butterfly GartleyTough one to call - Maybe my emotions here but technically seems were going to retest the lowest low!
Probability based on the technical's! 1.272 D wave is exactly the lowest low! It is what it is unless proven otherwise! :) There's no magic pill!
Rejecting off the anchored VWAP wasnt a good sign.
Trade the signals. No one kknows. Personally, I think lower. At the same time I dont feel it should. But feelings mean nada. Trade the levels.

"PEPE/USDT 1H: Downtrend Persists – Wait for Reversal !PEPE/USDT 1H: Downtrend Persists – Wait for Reversal Confirmation?
Current Market Structure:
Bearish downtrend with clear lower lows and lower highs.
RSI at 24.56, indicating oversold conditions, but no clear divergence has emerged.
Market Maker Activity:
Distribution phase is complete; the market is now in a markdown phase.
Smart money appears to be distributing at higher levels.
Key Levels:
Resistance: 0.00001020
Support: 0.00000842 (current)
Major Resistance: 0.00001040
Risk Assessment:
8/10 – High-risk environment.
Recommendation:
Do not take a long position despite oversold conditions.
Wait for a clear reversal pattern or a double bottom formation before considering entries, as current price action suggests further downside.
Confidence Level:
7/10 based on clear market structure and volume profile.
🚀 Follow me on TradingView if you respect our charts! 📈 Daily updates!

$PEPE Alt Elliott Wave CountAlt Elliott Wave Count, if the downturn continues further it increases the probability of this wave count we would get a rally but it would be the last one of this cycle. Odds increased towards this due to the failed impulse to the upside. I don't like this wave count and it's not the main count due to how long the wave (4) has extended 200+ days compared to (2) 130 days. But that Bybit hack crippled momentum at the right time to shift favor towards this count.
PEPE/USDT SELL WITH LIMIT ORDER PEPE have been sweeping liquidity around the sell side liquidity am looking forward to see p [rice take out the sell side with the complete bearish flag formation printed am going short from 0.00000900 and holding to see 0.000000700
JOIN AND ENJOY

PEPE ANALYSIS!If price returns to the green support zone 🟩, there is a potential bounce up 📈 as buyers could step in again in this demand zone.
📢 Join me for more trade setups!

Ready for liftoff! Looking at the 2 day chart… golden cross!!
Macd ready
Rsi ready to head back up…
Game time!!
Strap in for liftoff 🚀🚀

PEPE Spot Long Trade Psychological trade
the market behavior and trader psychology that can drive price movements during breakout events. Traders often react to certain price levels, trends, and patterns in ways that influence decision-making and price action.
How to Manage Psychological Challenges in Breakout Trades:
Plan and Discipline: Having a clear plan helps avoid the emotional traps that can lead to rash decisions. This includes setting entry points, stop losses, and take profits ahead of time, so traders don’t rely on emotional reactions to price moves.
Risk Management: Proper position sizing, stop losses, and using a risk-reward ratio can help mitigate the psychological stress of a breakout trade. When risk is controlled, traders are less likely to panic during a false breakout or sudden market reversal.
Avoiding Overtrading: Traders who become overzealous or overly excited about breakouts can end up entering trades without proper confirmation or at bad risk-reward ratios. Sticking to a strategy and being selective with trades helps in avoiding emotional burnout.
Recognize False Breakouts:
False breakouts can be psychologically draining, especially when traders experience significant losses. Being able to step back, reassess, and avoid chasing every breakout can help reduce the psychological impact.

PEPE LONG 40 x trade idea 1:40 PEPE has made a significant pullback from a huge leg upwards its now resting at a good demand zone im also charting the bitcoin dominance which is signalling a big push to the downside leading to alt coins pumping

Scenario PEPEThat's Pepe's scenario, at the current support he hopes to break upwards, or vice versa, it will most likely fall. Remember this scenario is not any trading advice, do your research before you enter it

#PEPE/USDT#PEPE
The price is moving in a descending channel on the 1-hour frame and is adhering to it well and is heading to break it strongly upwards and retest it
We have a bounce from the lower limit of the descending channel, this support is at a price of 0.00000935
We have a downtrend on the RSI indicator that is about to break and retest, which supports the rise
We have a trend to stabilize above the moving average 100
Entry price 0.00000950
First target 0.000000960
Second target 0.00001000
Third target 0.00001047

PEPE/USDT 1H: Bearish Consolidation Reversal –Target 0.00000970PEPE/USDT 1H: Bearish Consolidation Reversal – Next Target 0.00000970?
🚀 Follow me on TradingView if you respect our charts! 📈 Daily updates!
Current Market Condition:
Price currently at 0.00000928 in a bearish consolidation following a significant drop.
RSI at 46, showing neutral momentum.
Hidden bullish divergence is forming on RSI while price makes lower lows.
Market Maker Activity:
Accumulation is evident in the 0.00000890-0.00000920 zone with multiple tests, indicating MM buildup before the next leg up.
Key Levels:
Support: 0.00000890
Resistance: 0.00000970
Current Price: 0.00000928
Trade Setup (Confidence 7/10):
Entry: Consider a long entry at 0.00000920 with tight stops.
Targets:
T1: 0.00000950
T2: 0.00000970
Stop Loss: Place at 0.00000885.
Risk Score:
6/10 – Favorable risk-to-reward, but waiting for confirmation above 0.00000940 may offer a safer entry.
Recommendation:
Long positions are recommended given the MM accumulation and hidden bullish divergence.
Monitor for confirmation above 0.00000940 before fully committing.
🚀 Follow me on TradingView if you respect our charts! 📈 Daily updates!
