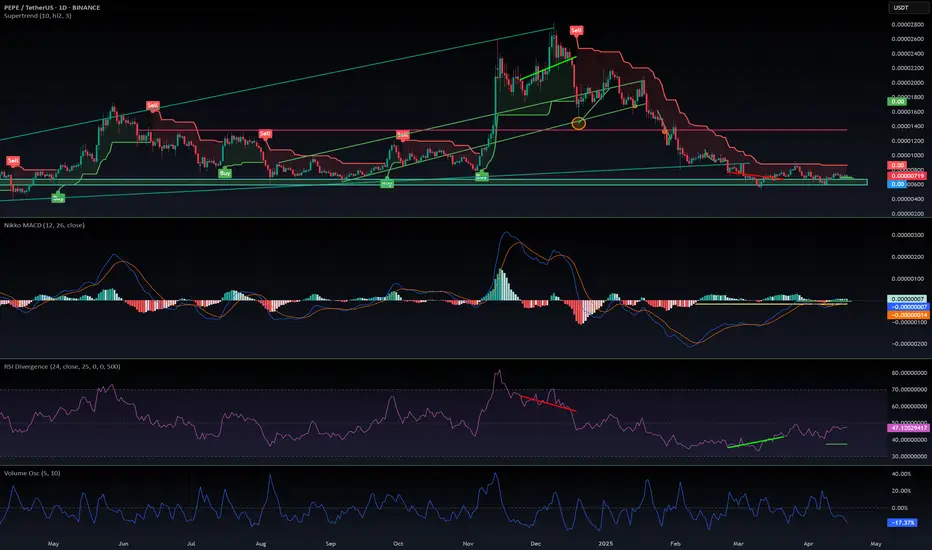
Pepe flashing golden cross signal! The overall market is shaky and btc will be a driving factor whether Pepe can pump with bullish momentum. With this said we have flashed a golden cross which is a good indication that momentum could be building. When we mix this with oversold ti on most time frames and a few bullish divergences showing, I feel Pepe could be ab to break out of our falling wedge pattern. Breaking our rsi downtrend on the daily will be a good starting point to gauge further market sentiment. Wait for confirmation.
PEPEUSDT trade ideas

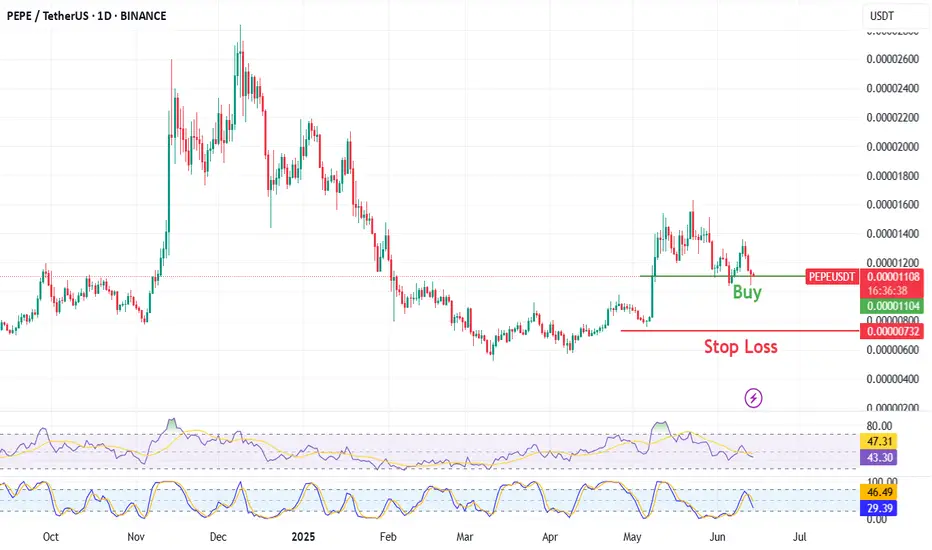
pepe updateentry price 0.00001425
stop loss update 0.00001425
take profit
0.00001172
0.00001022
0.0000086
result full target

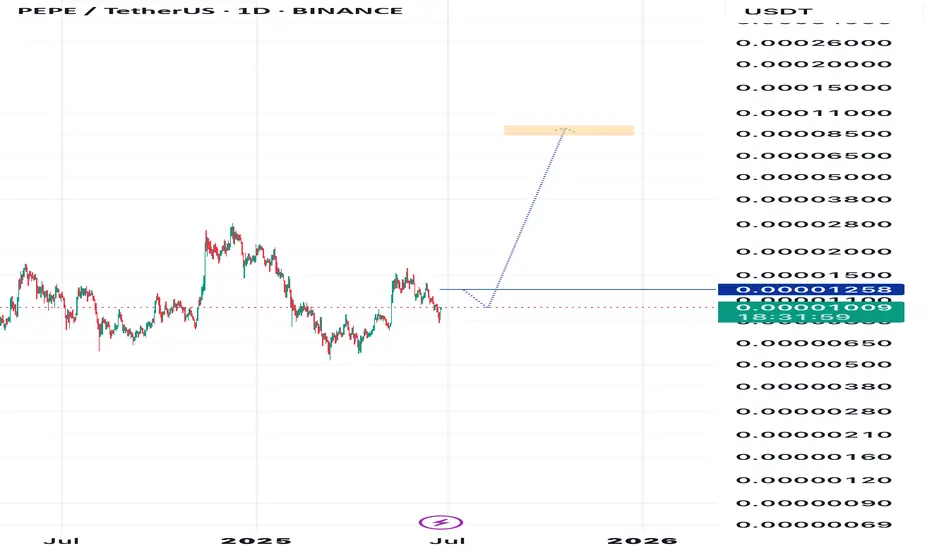
Pepe Prepares To Grow After 5 Weeks Red (5X Possible)I am sorry, the system is not working and won't let me write more than a few lines. This is the best I managed to publish without getting an error.
You can get the idea by looking at the chart and drawings. It points to higher prices in the coming weeks and months. Namaste.

Weekly Trendline Support Respected – PEPE Holding UpOnce again, CRYPTOCAP:PEPE is bouncing off its trusted rising trendline — a level that’s acted like solid ground for months.
Every time price hits this trendline, buyers show up. That’s a strong sign bulls are still in the game. As long as this line holds, the uptrend stays healthy.
Next challenge? That resistance zone above. If PEPE breaks through, we could see another leg higher. But if it loses the trendline, things might cool off toward the next support.


Long trade
📍 Pair: PEPEUSD
📅 Date: Monday, June 23, 2025
🕒 Time: 8:00 AM (NY Session AM)
⏱ Time Frame: 4 Hour
📈 Direction: Buyside
📊 Trade Breakdown:
Metric Value
Entry Price 0.00000912
Profit Level 0.00001046 (+14.69%)
Stop Loss 0.00000866 (−5.04%)
Risk-Reward
Ratio 2.91 : 1
🧠 Context / Trade Notes:
4H Order Block Entry:
The trade took off after a clear bullish order block formed, following a price tap into prior demand with a wick rejection.
Liquidity Grab Below Lows:
Price swept a 4H swing low before reversing, suggesting institutional accumulation below retail stops.

Pepe usdtUpdate
We going to 800% same chart before 2 years if you remember..
Back to old chart for pepe

$PEPE follow up for June 2025Follow-up on my previous CRYPTOCAP:PEPE analysis — it played out exactly as expected.
CRYPTOCAP:PEPE remains my top meme coin, backed by some of the strongest tokenomics in the space. When altseason hits — if it hits — this one is primed to pump hard.
Like most altcoins right now, CRYPTOCAP:PEPE is in a short-term corrective pattern. That opens up another great opportunity to enter low and potentially ride a 2x or 3x move on the next leg up.
I’ve marked my usual buy zone. It may seem optimistic for now, but history shows how fast meme coins can dump… and then recover just as quickly. A drop into that green zone is entirely possible.
📲 Follow me for alerts — I’m monitoring CRYPTOCAP:PEPE daily. It’s one of my top picks.
DYOR.
Here was the previous analysis:
#PEPE #MemeCoin #Altseason #CryptoGems #BuyTheDip #Altcoins #CryptoTrading #Tokenomics #DYOR #CryptoAlerts
PEPE TARGETS FOR 2025🔥 CRYPTOCAP:PEPE long setup (1 D) 🚀 (#1000PEPE )
✅ Entry Zone: 0.0086 – 0.0077 (year-long demand)
🎯 Targets
• TP-1: 0.00220 (Q4-24 supply flip)
• TP-2: 0.00280 (2024 breakdown block)
⛔ Stop-Loss
Daily close < 0.0068
📊 Thesis
• 11.7 T #PEPE scooped by whales in late May 🐋
• #Kraken spot volumes surge; PEPE now a top-10 coin on the exchange 📈
• New “#PEPE Meme” roadmap: P2E mobile game, NFT marketplace & L2 mini-chain 🕹️
• Whole #memecoin sector rotating after #DOGE ETF chatter & ETH ETF approval 📰
• Supply forever capped at 420.69 T; 100 % already in circulation 🟢
• Social reach 3.3 M+ on X, #TikTok campaigns rolling out 🎯

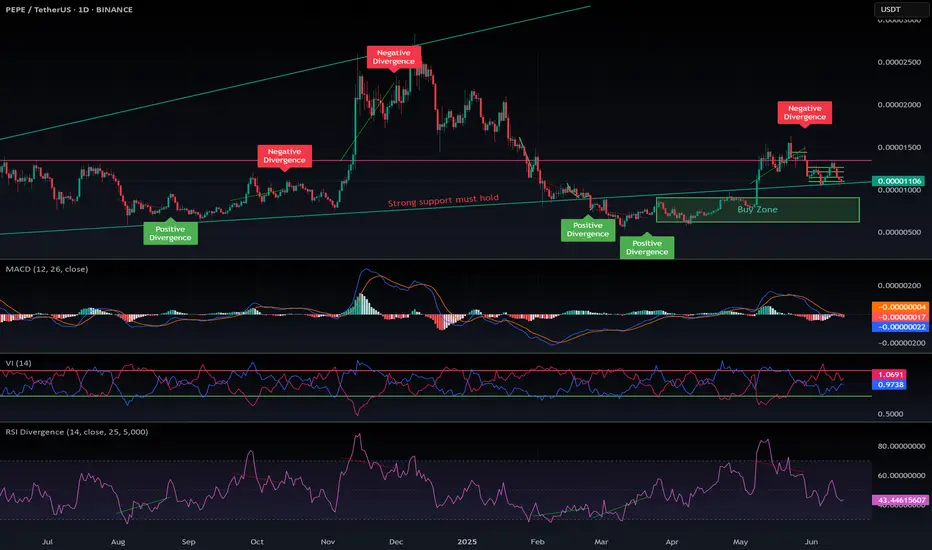
PEPE: Bull Market or Just Frog Legs on the Menu?Short-Term Perspective for BINANCE:PEPEUSDT
Over the past three months, the token has been in a downtrend, forming an impulsive structure. This raises concerns about whether PEPE is still in a bullish trend or if a deeper correction is underway.
In the near term, the key area to watch is the MA20week and MA200d levels, along with the price imbalance zones. With high probability, a short-term bullish movement could occur toward these resistance zones.
Long-Term Scenarios
From a broader perspective, three potential scenarios are in play:
Bullish Continuation – If the correction completes as expected, we could see the start of Wave V, leading to new highs.
Extended Correction – A larger corrective Wave IV could still be in progress, delaying a breakout.
Bearish Reversal – If price fails to reclaim key levels, a larger downward structure might develop, invalidating the bullish outlook.
The market structure remains uncertain, requiring further confirmation of bullish momentum. Monitoring price reaction at key resistance levels is crucial before making definitive trend assessments.
COINBASE:PEPEUSD

PEPEUSDT LONGGGGGGGGood entry for a long position. Support tested a few rounds before and it stand still. As a support, it is also at its lowest support zone.
Risk & Reward Ratio: 1:5
Worth trying🆙⬆️🆙⬆️


Most see capitulation. I see clean premium-to-discount deliveryPEPE just swept deep into the 0.786 retracement — right where most fear sets in. But Smart Money? This is where they reaccumulate. The structure isn't broken — it's resetting.
Here’s what the chart tells me:
Price dipped straight into the FVG + 0.786 (0.00000945) zone
That's the deepest discount before structural invalidation — exactly where Smart Money looks for reversal footprints
The upside draw sits cleanly at 0.00001194 (0.5 fib), with an extension possible toward 0.00001297 and even 0.00001424
This move down didn’t violate anything. It rebalanced prior inefficiency and opened the door for premium delivery.
Execution logic:
Accumulate within 0.00000945–0.00000918 (discount zone)
Invalidation: break below 0.00000758 closes the book on this setup
Targets: 0.00001194 → 0.00001297 → 0.00001424
The biggest moves don’t start when it feels safe. They start when it feels late.
For setups like this — built on logic, not luck — check the profile description. I trade where Smart Money trades.

Lingrid | PEPEUSDT buying Opportunity from Support ZoneBINANCE:PEPEUSDT has extended its decline within the broader downtrend, recently forming a new local lower low at the support zone around 0.000000947. Price action is now testing the lower boundary of the descending channel and support level with potential for a short-term bounce. A break above the 0.00000102–0.00000107 resistance cluster could ignite a rally back toward the key trendline and upper range near 0.00000117.
📈 Key Levels
Buy zone: 0.00000094–0.00000100
Sell trigger: loss of 0.00000094 support
Target: 0.00000117
Buy trigger: bullish breakout above 0.00000105 with volume
💡 Risks
Rejection from the trendline may push price into new lows
Continuation of lower lows signals trend pressure
Weak volume may stall breakout above 0.00000105
Traders, if you liked this idea or if you have your own opinion about it, write in the comments. I will be glad 👩💻

Pepe Short ResultPrice was in a strong bearish trend, even after the breakdown, price consolidated in a bear flag also under the major bearish trendline, which are all indicators of further breakdown.

PEPE Drops -8.09% — Point of Control Becomes Key BattlegroundPEPE has posted a sharp -8.09% daily correction, confirming a new lower low in the ongoing downtrend. Price action remains bearish after rejecting from the value area high, where it tapped into the 0.618 Fibonacci retracement and failed to break higher.
This rejection triggered a rotation back toward the point of control (POC), which now acts as the next major support level. The POC is in confluence with the 0.786 Fibonacci retracement and a monthly high-timeframe level, forming a strong zone of interest for both bulls and bears.
According to market profile theory, losing the value area high increases the likelihood of a full rotation to the value area low — and that’s now on the table if the POC fails to hold.
If price stabilizes and demand appears at the current level, we could see a short-term bounce or even a structure shift. However, if price breaks below the POC, a deeper correction becomes the more probable outcome.
Key Levels:
Resistance: 0.618 Fib / Value Area High
Support: Point of Control / 0.786 Fib
Bearish Bias until structure shifts

Long trade
🟢 PEPEUSDT – Buyside Trade
Date: Sunday, 15th June 2025
Session: Asia Session AM
Time: 6:15 AM
Entry Timeframe: Short-term (scalp entry)
Trade Parameters
Entry: 0.00001112
Take Profit: 0.00001158 (+4.14%)
Stop Loss: 0.00001101 (−0.99%)
Risk-Reward Ratio (RR): 4.18
🧠 Trade Reasoning
Price action on PEPEUSDT was consolidating within a tight range following a liquidity sweep beneath the 0.00001100 handle. Entry was taken after observing bullish confirmation at a micro demand zone, with the price reclaiming a short-term range low.

$PEPE looks ready to leap again!CRYPTOCAP:PEPE looks ready to leap again! 🐸
After its massive December 2024 rally, CRYPTOCAP:PEPE has undergone an equally strong correction — but signs suggest the bottom is in.
✅ Strong support at 0.0000700 and 0.0000650
✅ MACD stabilizing
✅ RSI showing a huge bullish divergence
Momentum is building — don’t lose sight of the frog! 🐸🚀
DYOR
#PEPE #Altcoins #CryptoTrading #BullishSetup #RSIDivergence #MemeCoinSeason #CryptoAlert #PEPEArmy
Short trade Pair: PEPEUSDT
Trade Type: Sell-side trade
Date: Saturday, 14th June 2025
Time: 6:30 AM
Session: London to New York Session AM
Entry Timeframe: 15min
📍 Trade Details
Entry Price: 0.00001111
Profit Level: 0.00001064 (4.23%)
Stop Level: 0.00001121 (0.90%)
Risk-to-Reward Ratio (RR): 4.70
🧠 Context / Trade note: Sell-side trade idea
Trade positioned during the London to NY session overlap, a high-volume window with strong directional momentum. Observed volume imbalance as price pushed into a minor supply zone — signs of liquidity sweep and exhaustion.
15min TF entry

#PEPEUSDT: Major Swing Upcoming! Get Ready! PEPEUSDT is currently in phase two of accumulation and will distribute the price soon. We expect the price to move in a bullish impulse pattern as we anticipate volatility in the coming days. However, we advise having a secondary bias while investing or trading on cryptocurrency, as it is highly risky and lacks the same volume as forex or gold.
Good luck and trade safely!
Team Setupsfx_

PEPE/USDTPEPE/USDT is looks good for buy it is showing retracement on daily chart and the 4hr chart also showing a good bullish divergence
Compression, rejection, and the trap belowPEPE isn’t random here — it’s in a calculated drawdown. Not a dump — a design. What looks like weakness is really compression into a reactive pocket.
The logic:
Price is descending inside a compression channel. But the real interest lies lower — specifically around the FVG and the untouched demand range down to 0.0000089. That’s the key.
The 0.0000103 zone is a surface-level fib level (0.382), but the deeper intention is beneath it — where Smart Money will want to accumulate before running it back into inefficiency.
Above us? There’s a massive void sitting between 0.0000115 and 0.0000126. That’s the draw — but not before a deeper sweep to fuel it.
Two key paths:
Ideal: Full sweep of 0.0000089 demand → strong reversal → drive back into the .5/.618 fib cluster near 0.0000115–0.0000126
If front-run: Hold near current level (0.0000103) and deliver into the FVG gap above
Anything below 0.0000083? That’s your invalidation. Until then, compression is the setup.
Final thought:
“Smart Money doesn’t chase the wick. It sets the trap — then steps in with size.”
