PEPE/USDT RSI, MACD, WTO all showing reversal potential1. Price Chart & Falling Wedge Pattern
PEPE is currently trading within a falling wedge, a pattern that typically signals a bullish reversal upon breakout.
Price just bounced from a key support zone around 0.000000525 - 0.000000690, forming a potential double bottom.
Still hugging the lower wedge boundary, meaning a breakout or a strong bounce is possible.
2. Ichimoku Cloud
Price is below the Kumo cloud, confirming a bearish long-term trend.
However, both Tenkan-sen and Kijun-sen are flat, hinting at a potential squeeze before a big move.
The future cloud is narrowing, showing reduced resistance in case of a bullish breakout.
3. RSI (Relative Strength Index)
RSI is around 30.12, entering oversold territory.
It's starting to curl upward, suggesting a possible bullish divergence.
4. WTO (Wave Trend Oscillator)
WTO is deep in the oversold zone, and a green signal dot just appeared.
This often indicates early signs of momentum reversal or upcoming bounce.
5. MACD
MACD just flipped bullish with a crossover below the zero line — a classic early reversal signal.
The histogram is turning green, confirming the downtrend is losing strength.
6. Cluster Algo
Both green and red lines are in deep oversold conditions, hovering close together — a sign of consolidation.
A green dot just flashed, another indication that a bullish move may be coming.
Summary
✅ Bullish signals:
Price sitting on major support + falling wedge pattern.
RSI, MACD, WTO all showing reversal potential.
Early signs of bullish divergence.
⚠️ Caution:
Long-term trend still bearish (below Ichimoku cloud).
No significant volume spike yet to confirm a breakout.
Suggested Strategy (Not financial advice):
Speculative entry: around 0.00000070 – 0.00000073
Stop-loss: below 0.00000052
Take-profits:
TP1: 0.00000105 (Fibonacci 0.5)
TP2: 0.00000131 (Fibonacci 0.618)
TP3: 0.00000223 (Fibonacci 0.786)
PEPEUSDT trade ideas

pepeusdt perp TAPrice Action & Trend Insights
Current Price: Approximately $0.00001382, based on recent data .
TradingView
Trend Analysis:
The price is trading above the 200-period moving average, indicating a potential uptrend.
The Ichimoku Cloud is green, and the price is above it, suggesting bullish momentum.
However, the MACD indicator is showing bearish signals, which could indicate a potential reversal or consolidation .

Pepe 5X Lev. Full PREMIUM Trade-Numbers (PP: 1670%)The market always offers a second chance. The full trade-numbers below have targets up to 0.00003381 for a maximum profits potential for 1670%. The chart goes higher and reaches 2235% (0.00004264) and 3715% at 0.00006575.
How far up it goes and how fast is for the market to decide.
These trade setups are good if we can catch the bullish breakout, once the breakout is in, the rest is an easy wait.
I know some people that are happy to secure their trades after 200-300%, some even at 100%. Others wait long-term because these are awesome chart setups and can reach much higher. In past cycles we've done trades with more than 10X easily. This is one of those.
The question is, will it hit or will it fall?
The market always offers a second chance and a second chance is upon us, now.
Full trade-numbers below:
_____
LONG PEPEUSDT
Leverage: 5X
Entry levels:
1) 0.00000810
2) 0.00000715
3) 0.00000690
4) 0.00000630
Targets:
3) 0.00000867
4) 0.00001071
5) 0.00001222
6) 0.00001408
7) 0.00001681
8) 0.00001953
9) 0.00002342
10) 0.00002836
11) 0.00003381
Stop-loss:
Close weekly below 0.00000625
Potential profits: 1670%
Capital allocation: 5%
_____
Why Pepe and not some other Altcoin?
I shared trade-numbers for you for pairs as varied as Bitcoin and Ethereum, Notcoin and Dogs, Solana and Filecoin, Pepe, EOS, XRP, Cardano and Compound, to name a few. The truth is that I pick what in the moment looks good.
Market conditions can always change, but at the time of writing the chart looks great.
Notice that the action is 100% full red, that's the time to buy as I always remind and say; Buy when prices are low or trading near support; buy when the market is red.
The market is red now and that's the time to buy before a reversal happens. You will see, our time to sell comes when the market turns green.
Many average players will do it in reverse, right now they are selling and they will buy at the top of the bullish wave. I know, it is tempting, it is the market impulse but we have to learn to control our emotions if want success in this game.
There is risk involved. Leveraged trading is for experts only.
Thanks a lot for your continued support.
Namaste.

PEPE/USDT Potential UpsidesHey Traders, in today's trading session we are monitoring PEPE/USDT for a buying opportunity around 0.00001360 zone, PEPE/USDT is trading in an uptrend and currently is in a correction phase in which it is approaching the trend at 0.00001360 support and resistance area.
Trade safe, Joe.


PEPEUSDT heading towards weekly supportThis is something I shared last year for PEPEUSDT. The price had hit monthly resistance MS1 and bounced from there towards weekly resistance WR1.
The current price action says it is in pullback mode of the current move up that we experienced for a few weeks.
I think the price will continue this pullback towards weekly support WS1 where the price will bounce. However, we have be watchful if the price attempts again at WR1 and succeeds before reaching to WR1.
If the price, hits WR1, a long is a very high probability trade and I will share a long setup there.

Short trade
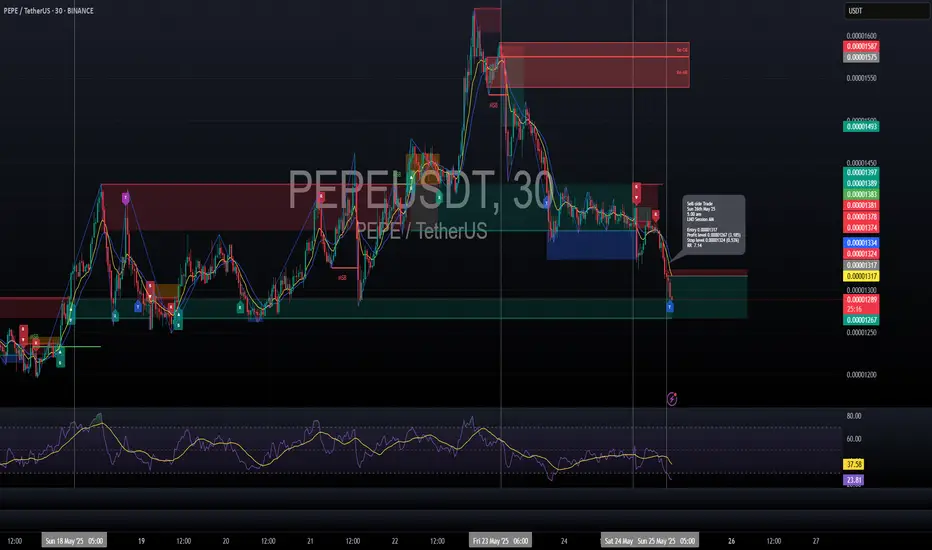
🟥 Sell-side Trade Log
📉 Pair: PEPE/USDT
🏷️ Type: Intraday | LND Session AM
🧠 Setup: Breakout
📅 Date: Sunday, 26th May 2025
🕔 Time: 5:00 AM
🔹 Entry Price: 0.00001317
🔹 Profit Target: 0.00001267 (+3.18%)
🔹 Stop Loss: 0.00001324 (-0.53%)
🔹 Risk-Reward Ratio: 7.14
🔍 Reasoning:
This sell-side breakout trade was initiated during the LND AM session following a clean break of consolidation support, with price accelerating through key short-term liquidity.
PEPE RIGHT TIME TO BUY PEPE coin is currently gaining momentum as market sentiment turns bullish across meme coins. With increased community engagement, rising trading volume, and attention from crypto influencers, PEPE appears poised for its next leg up. If current support holds and broader market conditions remain favorable, PEPE could break out from its current consolidation and target the next resistance level, potentially setting a new short-term high.

Impulse or Illusion? Key Level to Watch If you find this information inspiring/helpful, please consider a boost and follow! Any questions or comments, please leave a comment!
Recap
Since the price surge off the March 11 low, structure appears to be developing into a potential 5-wave impulse. However, with only three legs printed so far, it remains premature to confirm the full impulse structure.
Structure Assessment
The move resembles a possible ABC zigzag, but the center leg (possible wave 3) is showing strong impulsive characteristics — momentum, follow-through, and vertical lift. That raises the probability of it being an unfolding wave 3, rather than just a C wave.
What’s missing? A clear wave 4.
Until a fourth wave correction is established, and followed by a decisive wave 5, the bullish impulsive count remains tentative.
Outlook
📌 Key level: 0.00001087
The hold of this level will make the look of the structure ideal.
A break below 0.00001087 would dip into unacceptable territory for a developing wave 4 and opens the door to a bearish reassessment — and if the PA enters the price territory of the wave 1 cause a conclusive invalidation of the potential impulse.
✅ If price holds the level and a shallow wave 4 consolidates, we can then watch for signs of wave 5 to confirm the impulse and unlock bullish continuation potential.
Watch this level. Structure will confirm or collapse soon. More updates to follow.
Trade safe, trade smart, trade clarity.

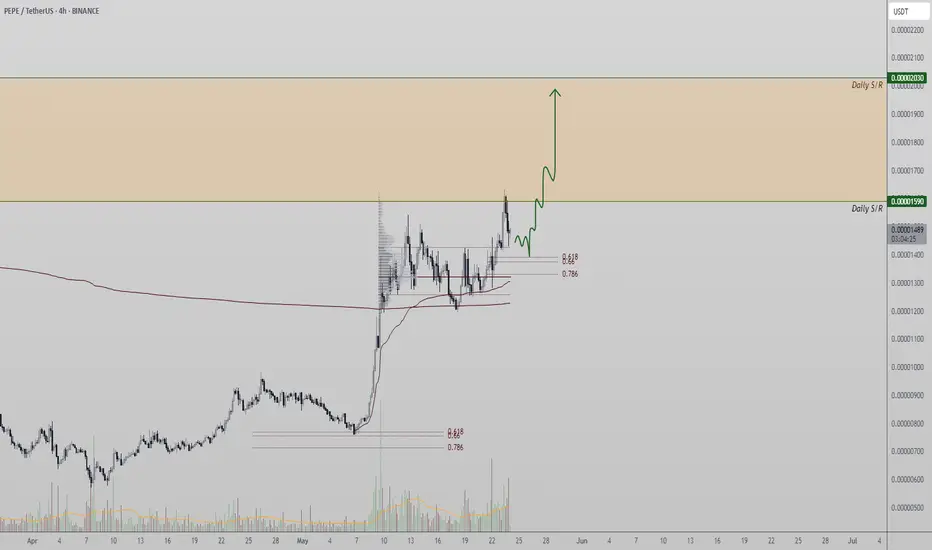
PEPE/USDT – Bullish Pullback Sets Up Next Leg HigherPEPE has recently pulled back from local resistance after establishing a new higher high in its ongoing bullish trend. Rather than being a sign of weakness, this rejection is a typical development in trending markets—where a higher low often follows to build momentum for the next leg up.
Looking at the 4H timeframe, price action is currently hovering around a key support zone near the value area high, which aligns closely with the 0.618 Fibonacci retracement level. This area is acting as a technical confluence and could serve as the next potential higher low if PEPE can hold above it on multiple 4-hour candle closes.
A sustained hold at this level would likely trigger a rotation back toward the recent resistance, increasing the probability of a breakout and further continuation to higher levels. The current correction should be viewed as a bullish retest, presenting a possible “buy the dip” opportunity within a strong market structure.
From a technical perspective, as long as PEPE maintains support at this zone, the bullish trend remains intact. Momentum indicators continue to lean in favor of the bulls, and volume behavior remains consistent with prior accumulation phases before impulsive moves.
In summary, PEPE is showing signs of healthy consolidation within a bullish framework. The recent rejection is more likely a setup for continuation rather than reversal. If the support zone holds, the market could soon be eyeing a fresh breakout and a test of higher resistance levels in the sessions ahead.
PEPE 1D Harmonic Pattern Setting Up for a Bullish Breakout!Hey traders!
I'm spotting a potential bullish setup on #PEPEUSDT — and it’s one worth watching closely.
🔍 Technical Overview:
On the 1D time frame, #PEPE is forming a textbook harmonic pattern — still confirming.
No bearish divergence or reversal signs spotted so far — momentum remains intact.
Key level to watch: B point of the harmonic pattern, acting as strong horizontal resistance.
🎯 Trade Idea:
Plan: Wait for a clean breakout above the B-level, followed by a successful retest.
If the retest holds as support, I’ll be entering a long position with tight risk management.
TP-1: 0.00001292
TP-2: 0.00001647
SL: 0.00000549
⚠️ Why patience matters: Jumping in too early can expose you to fakeouts. Confirmation = confidence!
💬 What do YOU think? Is #PEPE about to explode or will the resistance hold? Drop your thoughts below! 👇
📈 If you find this helpful, don’t forget to: 👍 Like
💬 Comment
🔁 Share
📌 Follow me for more high-probability setups!
Let’s trade smart, not emotional. 💡
#PEPE #CryptoTrading #HarmonicPattern #BreakoutSetup #TechnicalAnalysis #TradingView #CryptoCommunity #Altcoins

Pepe Hits New Daily High, What Now?Pepe just hit a new high today, and the highest price since late January 2025. A full correction recovery is now in place but the action is never flat on this pair. We can see down-waves and up-waves. It alternates.
This new high is good. It is not so strong but still, slow and steady growth which is bullish. Trading volume is still low which at this point we take as a continuation signal, which means that there is plenty of room left available for additional growth.
Imagine this pair keeps rising and rising, still low volume. When huge volume comes in, that's when the strong advance will happen and we see 200-300% in a matter of days. While the rest of the time, months and months of growth, the pair is always growing but slowly. That is why patience is key.
See this, PEPEUSDT has grown by almost 200% since its March/April low, wow. And it will continue growing.
Thanks a lot for your continued support.
You can see the related publications for the full trade-numbers with leverage for this pair.
Thank you for reading.
Namaste.


PEPE Technical Analysis – Daily TimeframePEPE Technical Analysis – Daily Timeframe
PEPE is currently forming two strong bullish technical patterns, both suggesting significant upside potential if a key resistance level is broken with confirmation.
📌 Scenario 1 : Bullish Flag Pattern
If the price breaks and holds above the $0.00001500 resistance on the daily timeframe, the bullish flag pattern may become active.
This pattern projects a potential move toward the $0.00003000 level, which aligns with the previous all-time high (ATH).
📈 Estimated upside: +90% from the current price.
📌 Scenario 2 : Cup Formation
In the broader structure, PEPE appears to be forming a cup pattern.
A confirmed breakout above $0.00001500 could open the door to a new all-time high around the $0.00004000 level.
📈 Estimated upside: +170%, assuming full pattern completion.
✅ In both scenarios, a strong breakout above $0.00001500 with volume is the key condition for bullish continuation.
Until then, short-term volatility or consolidation remains possible.
📌 This analysis is for educational and informational purposes only and does not constitute financial advice.
This cryptocurrency has two key support levels.
As long as the price remains above these supports, there is still hope for a potential reversal and continuation of the uptrend.
The first support is at $0.00001200
The second support is at $0.00001050
📝 Follow me for updates and more crypto analyses.

PEPE AGAIN!!!Hello friends
Considering the good growth we had, you can see that the price has made a correction and entered a range after reaching its ceiling.
Now, with the price correction, there is a good opportunity to buy in a pipeline and with capital management and move with it to the specified goals.
*Trade safely with us*

PEPEUSDT Creating Retracement? or Start to Downall?Based on current Price Action, Pepe looks like collecting momentum to having a significant bearish movement. But the problem is ; is it bullish retracement or starting of bearish trend.

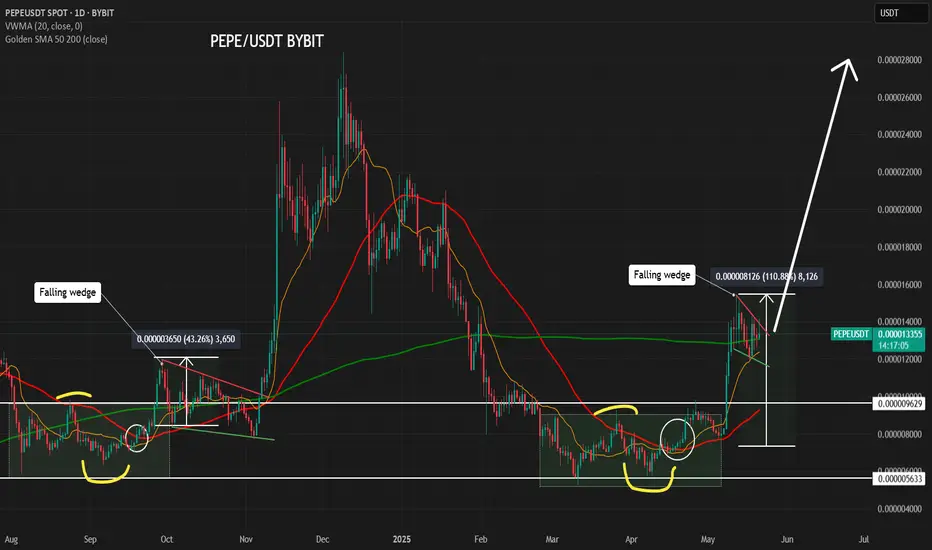
PEPE - PREPARING FOR A BREAKOUT AND NEW ATH??Pepe have performed very similar price action from late february -25 til now, compared to the price action between end of jul to start of october -24.
If history will rhyme - if it doesnt repeat it often rhymes - PEPE is preparing for a breakout to the upside, possible looking for new ATH.
Between 12 - 21th May 2025 we also see a falling wedge, similar to the falling wedge between 29th Sep - 07 Nov 2024 followed by a breakout to the upside and new ATH.
Are you prepared for what is coming?
Im looking for a Leverage Long position when we breakout from the falling wedge. This could be a huge monster trade.
(This is not Financial Advice, DYOR. Just sharing my ideas).
Pepe/Usdt Long % 150 A major breakout in Pepe/USDT is expected to start soon. There is a formation similar to the previous bull run. The bull mode is about to be activated, everyone get ready. We are starting.

PEPE PEPE is currently in the $0.000012-$0.000014 area, trying to break through $0.000015 and head towards $0.000018.
Buy area = $0.0000125-$0.0000138
Stoploss = $0.00001210
Target Profit = $0.000017-$0.000018

High R/R Swing Setup on PEPE – Eyes on 100%+ MoveThe 1D chart for PEPEUSDT is showing a clean bullish structure, supported by repeated rejections from a key support level and a recent breakout above short-term resistance. This setup offers a simple yet potentially high-reward trade opportunity for swing traders.
📊 Trade Setup
Entry: 0.00001269 USDT
Price has confirmed a bullish reversal and is currently hovering above a minor consolidation range, presenting a strong opportunity for a long position.
Stop Loss: 0.00001079 USDT
Placed just below the previous local lows to invalidate the setup in case of a breakdown.
Take Profit 1 (TP1): 0.00002135 USDT
This level represents a previous high and a clear horizontal resistance zone.
Take Profit 2 (TP2): 0.00002844 USDT
A higher resistance level, also aligning with historical price action, offering a potential 103% gain from entry.
📈 Technical Justification
Key Support Holding: Price has shown multiple rejections near the 0.00000565 USDT level, forming a strong support base. Each rejection has resulted in a higher low, indicating increasing bullish momentum.
Trendline Confirmation: The ascending trendline shows sustained bullish pressure and confirms the strength of the ongoing trend.
Breakout Setup: Current price action indicates a breakout from consolidation, supported by volume. The bullish structure remains intact as long as the price holds above the 0.00001079 SL region.
Risk-to-Reward: The setup offers an attractive 4.5 R/R ratio, making it highly favorable for swing trading.
📌 Summary
This is a clean, trend-continuation trade with defined risk and strong technical backing. Traders looking for a mid-term opportunity should keep an eye on volume and price action around TP1 for potential partial exits or trailing stop adjustments.

Long trade
1Hr TF overview
🟩 Buyside Trade Log
📈 Pair: PEPE/USDT
🏷️ Type: Intraday | LND Session AM
🧠 Setup: Breakout
📅 Date: Sunday, 18th May 2025
🕥 Time: 10:45 AM
🔹 Entry Price: 0.00001317
🔹 Profit Target: 0.00001480 (+12.38%)
🔹 Stop Loss: 0.00001312 (-0.38%)
🔹 Risk-Reward Ratio: 32.60
🔍 Reasoning:
This buyside trade capitalised on a breakout from consolidation during the London AM session.

PEPE/USDT is Nearing an Important ResistanceHey Traders, in today's trading session we are monitoring PEPE/USDT for a selling opportunity around 0.00001330 zone, PEPE/USDT is trading in a downtrend and currently is in a correction phase in which it is approaching the trend at 0.00001330 support and resistance area.
Trade safe, Joe.

Buy Trade Strategy for PEPE: Riding the Meme Coin MomentumDescription:
This trading idea is based on PEPE, a meme-based cryptocurrency that has rapidly gained popularity within the crypto community. Inspired by internet culture and viral trends, PEPE has seen significant growth fueled by social media attention, community-driven hype, and speculative momentum. While meme coins often lack traditional utility, they thrive on community engagement, branding, and timing — factors that have historically driven explosive gains in the crypto market. PEPE benefits from being part of this high-risk, high-reward niche, attracting traders who aim to capitalize on short- to mid-term momentum.
Still, it's crucial to understand that meme coins like PEPE are among the most volatile and speculative assets in the crypto space. Their price can be heavily influenced by market sentiment, influencer activity, and rapid shifts in investor interest. As such, trading PEPE requires strict risk management and a clear understanding of the speculative nature of the asset.
Disclaimer:
This trading idea is for educational purposes only and does not constitute financial advice. Meme coins like PEPE involve a high degree of risk, and investors should be prepared for extreme volatility and potential total capital loss. Always do your own research, consider your financial position, and consult with a qualified advisor before making any investment decisions. Past performance does not guarantee future results.
