PEPE at Key Reversal Zone — Support Test Coming Soon?Today I want to look at the PEPE token ( BINANCE:PEPEUSDT ), which is part of the memecoin category, and provide you with a short-term analysis on the 1-hour timeframe .
PEPE token is trading in Potential Reversal Zone(PRZ) .
In terms of Elliott wave theory , the PEPE token appears to be completing the microwave 5 of the main wave C . The structure is a Zigzag Correction(ABC/5-3-5) .
Also, we can see the Regular Divergence(RD-) between Consecutive Peaks .
I expect the PEPE token to attack the Support zone($0.0000120-$0.0000108) after completing the main wave C .
Note: Stop Loss = $0.0000362
Please respect each other's ideas and express them politely if you agree or disagree.
Pepe Analyze (PEPEUSDT), 1-hour time frame.
Be sure to follow the updated ideas.
Do not forget to put a Stop loss for your positions (For every position you want to open).
Please follow your strategy and updates; this is just my Idea, and I will gladly see your ideas in this post.
Please do not forget the ✅' like '✅ button 🙏😊 & Share it with your friends; thanks, and Trade safe.
PEPEUSDT_BBA8F8 trade ideas

Lingrid | PEPEUSDT Fake Breakout Correction Eyes 0.00014BINANCE:PEPEUSDT has rebounded from key horizontal support near 0.00001105 after a sharp pullback broke below the upward channel. Price is now consolidating just above the lower structure with signs of a bullish reversal pattern forming. A higher low around support could trigger a fresh move toward 0.00001395.
📈 Key Levels
Buy zone: 0.00001105–0.00001130
Buy trigger: bullish candle above 0.00001160
Target: 0.00001395
Sell trigger: daily close below 0.00001100
💡 Risks
Breakdown of 0.00001100 opens path toward 0.00001000
Consolidation below channel weakens bullish bias
Failure to reclaim upward trendline may delay breakout potential
Traders, if you liked this idea or if you have your own opinion about it, write in the comments. I will be glad 👩💻

"PEPE 1H Analysis - Breakout Incoming? 📊 *PEPE/USDT – 1H Technical Analysis*
An ascending triangle pattern is developing on the 1-hour timeframe, which often indicates potential bullish momentum.
🟢 Price is approaching a key resistance near *0.00001516*.
🟡 A clean breakout above this level with strong volume may open the door for further upside.
🔴 Watch for *confirmation* before considering any move.
🔍 This chart is purely for educational and analytical purposes.
No financial advice. Do your own research before making any trading decisions.
#PEPE #PEPEUSDT #Crypto #TechnicalAnalysis #TradingView #Altcoins

PEPEUSDT Bullish Breakout Potential from Falling WedgeChart Pattern: Falling wedge (bullish) identified on the weekly chart.
Indicators:
RSI: Above 50 on daily, weekly, and monthly charts, indicating bullish momentum across timeframes with no immediate overbought conditions (RSI < 70).
EMA: Bullish on weekly and monthly charts (price above key EMAs).
Current Sentiment: Mixed but leaning bullish. X posts highlight optimism, with traders noting a bullish pennant, whale accumulation, and parallels to PEPE’s 2023 breakout structure. However, recent price dips suggest caution.
Key Narratives:
A dormant whale withdrawing 2.2T PEPE ($29M) from Binance on May 19 signals strong holder confidence.
Predictions of a 50-100% rally if the short term bullish pennant breaks, with a potential new ATH in June 2025.
Correlation with Bitcoin’s ATH proximity suggests PEPE could benefit from a broader crypto rally.
Conclusion:
PEPE is well-positioned for a potential bullish breakout in the near term, supported by the falling wedge, RSI > 50, and bullish EMAs across timeframes. Its meme coin nature ties its performance to community hype and broader crypto market trends, particularly Bitcoin’s trajectory.
Not financial advice.

They saw weakness. I saw PEPE return to the source.Every time price dropped today, people called it a breakdown.
But Smart Money doesn’t break price — they rebalance it.
PEPE just swept the prior low into 0.00001145 — the 0.786 retracement — and bounced. No hesitation. That wick? That was engineered. The goal wasn’t to fall — it was to fill.
Now we sit below the 15m OB at 0.00001167–0.00001175. That’s the gate. If price reclaims and consolidates above this zone, the next draw becomes obvious: 0.00001204 — clean inefficiency, clean liquidity.
If it rejects? Watch for one more final liquidity raid into 0.00001129 before the macro expansion.
Execution breakdown:
🔑 Entry: 0.00001145 (0.786)
🎯 TP 1: 0.00001175 (OB mitigation)
🎯 TP 2: 0.00001204 (full inefficiency reclaim)
❌ Invalidation: sustained close below 0.00001129
The chart didn’t break down.
It paused — to let the untrained exit early.

Pepe 5X Lev. Full PREMIUM Trade-Numbers (PP: 1670%)The market always offers a second chance. The full trade-numbers below have targets up to 0.00003381 for a maximum profits potential for 1670%. The chart goes higher and reaches 2235% (0.00004264) and 3715% at 0.00006575.
How far up it goes and how fast is for the market to decide.
These trade setups are good if we can catch the bullish breakout, once the breakout is in, the rest is an easy wait.
I know some people that are happy to secure their trades after 200-300%, some even at 100%. Others wait long-term because these are awesome chart setups and can reach much higher. In past cycles we've done trades with more than 10X easily. This is one of those.
The question is, will it hit or will it fall?
The market always offers a second chance and a second chance is upon us, now.
Full trade-numbers below:
_____
LONG PEPEUSDT
Leverage: 5X
Entry levels:
1) 0.00000810
2) 0.00000715
3) 0.00000690
4) 0.00000630
Targets:
3) 0.00000867
4) 0.00001071
5) 0.00001222
6) 0.00001408
7) 0.00001681
8) 0.00001953
9) 0.00002342
10) 0.00002836
11) 0.00003381
Stop-loss:
Close weekly below 0.00000625
Potential profits: 1670%
Capital allocation: 5%
_____
Why Pepe and not some other Altcoin?
I shared trade-numbers for you for pairs as varied as Bitcoin and Ethereum, Notcoin and Dogs, Solana and Filecoin, Pepe, EOS, XRP, Cardano and Compound, to name a few. The truth is that I pick what in the moment looks good.
Market conditions can always change, but at the time of writing the chart looks great.
Notice that the action is 100% full red, that's the time to buy as I always remind and say; Buy when prices are low or trading near support; buy when the market is red.
The market is red now and that's the time to buy before a reversal happens. You will see, our time to sell comes when the market turns green.
Many average players will do it in reverse, right now they are selling and they will buy at the top of the bullish wave. I know, it is tempting, it is the market impulse but we have to learn to control our emotions if want success in this game.
There is risk involved. Leveraged trading is for experts only.
Thanks a lot for your continued support.
Namaste.

Long trade
4Hr TF overview
Trade Journal Entry — PEPEUSDT (Buyside Trade)
🗓 Date: Sunday 1st June 2025
⏰ Time: 12:00 PM
📍 Session: London PM
📈 Timeframe: 4-Hour (Swing Setup)
📊 Market Structure Tool: Higher Low Formation + FVG Entry
🧠 Confirmation Tool: Break of Structure + Discounted Entry Zone
15min TF overview
🔹 Trade Details:
Entry Price: 0.00001188
Take Profit: 0.00001356 (+14.14%)
Stop Loss: 0.00001138 (−4.21%)
Risk-Reward Ratio: 3.36
🔹 Technical Breakdown:
Market Structure:
Price formed a higher low in line with bullish trend continuation.

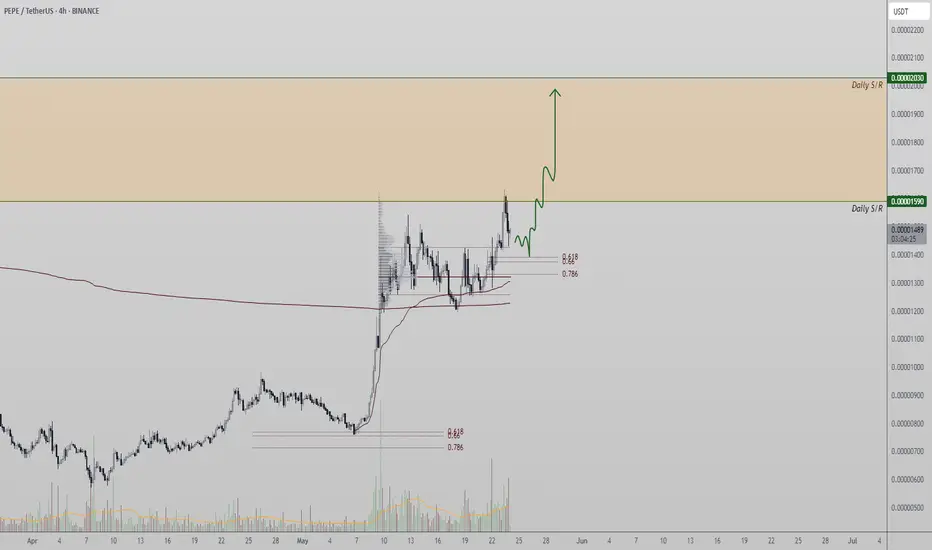
Pepe towards 0.00001500 target personal idea: we can see some signs of recovery in market as the Bitcoin holding up of 102k price, if this scenario happened, pepe likely take 0.00001500 target. Good 🙂 luck 👍

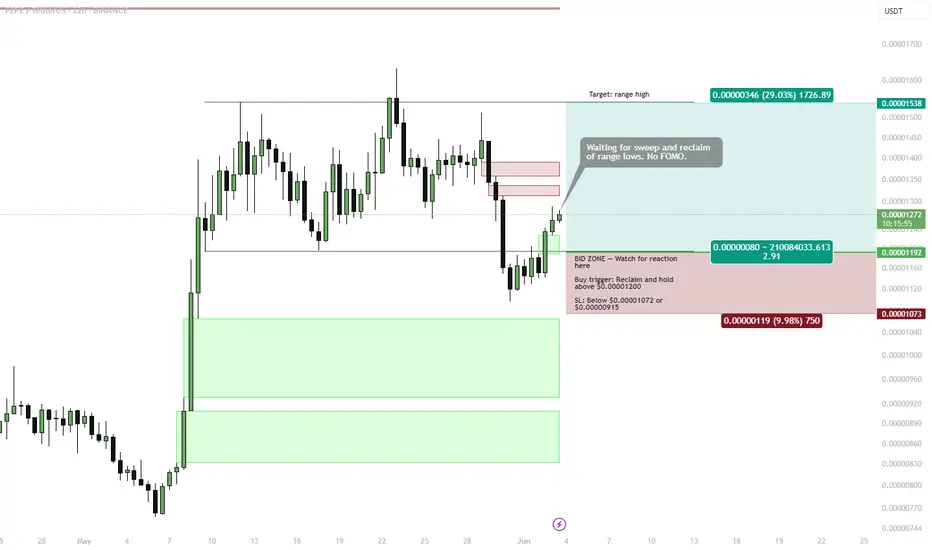
PEPE | range play — Reclaim Setup Targeting Range HighPrice has swept the range lows and is now attempting a reclaim of the lower boundary around 0.00001200. This creates a potential long setup targeting the range high if structure holds.
Setup:
🟩 Buy Trigger: Reclaim and hold above 0.00001200
• Entry confirmed after bullish reclaim
• SL: Below 0.00001072 or conservative below 0.00000915
📌 BID ZONE: 0.00001120–0.00001190
• Watch for reaction here — ideal place to enter during a retest
🎯 Target:
• Range High: 0.00001538 (~+29%)
Risk-Reward:
• R:R ≈ 2.9
• Setup remains invalid if price drops below bid zone or fails to hold the reclaim
Note:
⛔ No FOMO. Wait for confirmation — reclaim first, entry second.
PEPE/USDT Potential UpsidesHey Traders, in today's trading session we are monitoring PEPE/USDT for a buying opportunity around 0.00001360 zone, PEPE/USDT is trading in an uptrend and currently is in a correction phase in which it is approaching the trend at 0.00001360 support and resistance area.
Trade safe, Joe.

Don't miss today's signal.Hello friends
Given the good growth we had, the price has corrected and now we can buy in steps in the specified areas with capital and risk management and move with it to the set goals.
*Trade safely with us*

PEPE/USDT RSI, MACD, WTO all showing reversal potential1. Price Chart & Falling Wedge Pattern
PEPE is currently trading within a falling wedge, a pattern that typically signals a bullish reversal upon breakout.
Price just bounced from a key support zone around 0.000000525 - 0.000000690, forming a potential double bottom.
Still hugging the lower wedge boundary, meaning a breakout or a strong bounce is possible.
2. Ichimoku Cloud
Price is below the Kumo cloud, confirming a bearish long-term trend.
However, both Tenkan-sen and Kijun-sen are flat, hinting at a potential squeeze before a big move.
The future cloud is narrowing, showing reduced resistance in case of a bullish breakout.
3. RSI (Relative Strength Index)
RSI is around 30.12, entering oversold territory.
It's starting to curl upward, suggesting a possible bullish divergence.
4. WTO (Wave Trend Oscillator)
WTO is deep in the oversold zone, and a green signal dot just appeared.
This often indicates early signs of momentum reversal or upcoming bounce.
5. MACD
MACD just flipped bullish with a crossover below the zero line — a classic early reversal signal.
The histogram is turning green, confirming the downtrend is losing strength.
6. Cluster Algo
Both green and red lines are in deep oversold conditions, hovering close together — a sign of consolidation.
A green dot just flashed, another indication that a bullish move may be coming.
Summary
✅ Bullish signals:
Price sitting on major support + falling wedge pattern.
RSI, MACD, WTO all showing reversal potential.
Early signs of bullish divergence.
⚠️ Caution:
Long-term trend still bearish (below Ichimoku cloud).
No significant volume spike yet to confirm a breakout.
Suggested Strategy (Not financial advice):
Speculative entry: around 0.00000070 – 0.00000073
Stop-loss: below 0.00000052
Take-profits:
TP1: 0.00000105 (Fibonacci 0.5)
TP2: 0.00000131 (Fibonacci 0.618)
TP3: 0.00000223 (Fibonacci 0.786)


PEPE Ready to Rip? 3 Take-Profits Lined Up from This Key SupportPEPEUSD is currently forming a potential bullish reversal near the key support zone between 0.00001060 and 0.00001099. This level has acted as a solid demand zone previously, with price bouncing off this range multiple times in the recent past. The current price action suggests consolidation above this level, hinting at potential accumulation by buyers.
We can observe a compression in volatility, with recent candles showing smaller bodies and longer wicks near support—classic signs of weakening bearish momentum. The prior price rejection from the 0.00001318 zone and the smooth retracement to support further confirm this as a healthy correction rather than a trend breakdown.
The DPO (Detrended Price Oscillator) is hovering close to zero, suggesting the asset is entering a potential pivot zone. A move into positive territory would support the bullish scenario, ideally confirmed by an increase in volume on the breakout above short-term resistance.
This setup is particularly attractive for scalpers or short-term traders, aiming to capture quick momentum surges across multiple resistance levels.
📌 Trade Setup
• Entry Zone: 0.00001167–0.00001177
• Stop-Loss (SL1): 0.00001060
• Take-Profit 1 (TP1): 0.00001318
• Take-Profit 2 (TP2): 0.00001443
• Take-Profit 3 (TP3): 0.00001603
Strategy Note: The risk-to-reward ratio is highly favorable, particularly for TP2 and TP3. The setup allows for flexible scaling of positions as price hits each resistance level. With no immediate macro threats on the 4H structure and price defending support, this setup offers a clean bullish opportunity.

pepeusdt perp TAPrice Action & Trend Insights
Current Price: Approximately $0.00001382, based on recent data .
TradingView
Trend Analysis:
The price is trading above the 200-period moving average, indicating a potential uptrend.
The Ichimoku Cloud is green, and the price is above it, suggesting bullish momentum.
However, the MACD indicator is showing bearish signals, which could indicate a potential reversal or consolidation .


PEPEUSDT heading towards weekly supportThis is something I shared last year for PEPEUSDT. The price had hit monthly resistance MS1 and bounced from there towards weekly resistance WR1.
The current price action says it is in pullback mode of the current move up that we experienced for a few weeks.
I think the price will continue this pullback towards weekly support WS1 where the price will bounce. However, we have be watchful if the price attempts again at WR1 and succeeds before reaching to WR1.
If the price, hits WR1, a long is a very high probability trade and I will share a long setup there.

PEPE RIGHT TIME TO BUY PEPE coin is currently gaining momentum as market sentiment turns bullish across meme coins. With increased community engagement, rising trading volume, and attention from crypto influencers, PEPE appears poised for its next leg up. If current support holds and broader market conditions remain favorable, PEPE could break out from its current consolidation and target the next resistance level, potentially setting a new short-term high.

Impulse or Illusion? Key Level to Watch If you find this information inspiring/helpful, please consider a boost and follow! Any questions or comments, please leave a comment!
Recap
Since the price surge off the March 11 low, structure appears to be developing into a potential 5-wave impulse. However, with only three legs printed so far, it remains premature to confirm the full impulse structure.
Structure Assessment
The move resembles a possible ABC zigzag, but the center leg (possible wave 3) is showing strong impulsive characteristics — momentum, follow-through, and vertical lift. That raises the probability of it being an unfolding wave 3, rather than just a C wave.
What’s missing? A clear wave 4.
Until a fourth wave correction is established, and followed by a decisive wave 5, the bullish impulsive count remains tentative.
Outlook
📌 Key level: 0.00001087
The hold of this level will make the look of the structure ideal.
A break below 0.00001087 would dip into unacceptable territory for a developing wave 4 and opens the door to a bearish reassessment — and if the PA enters the price territory of the wave 1 cause a conclusive invalidation of the potential impulse.
✅ If price holds the level and a shallow wave 4 consolidates, we can then watch for signs of wave 5 to confirm the impulse and unlock bullish continuation potential.
Watch this level. Structure will confirm or collapse soon. More updates to follow.
Trade safe, trade smart, trade clarity.

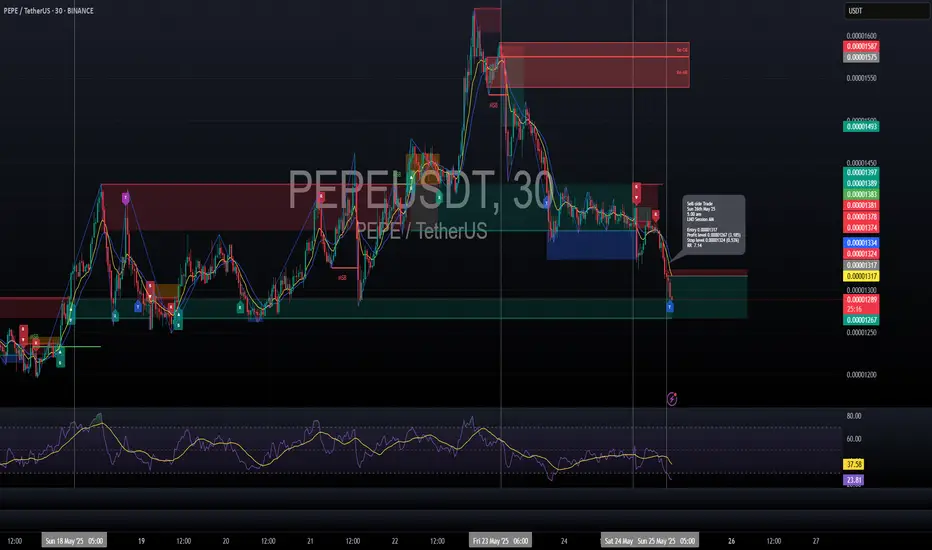
Short trade
🟥 Sell-side Trade Log
📉 Pair: PEPE/USDT
🏷️ Type: Intraday | LND Session AM
🧠 Setup: Breakout
📅 Date: Sunday, 26th May 2025
🕔 Time: 5:00 AM
🔹 Entry Price: 0.00001317
🔹 Profit Target: 0.00001267 (+3.18%)
🔹 Stop Loss: 0.00001324 (-0.53%)
🔹 Risk-Reward Ratio: 7.14
🔍 Reasoning:
This sell-side breakout trade was initiated during the LND AM session following a clean break of consolidation support, with price accelerating through key short-term liquidity.
PEPE/USDT – Bullish Pullback Sets Up Next Leg HigherPEPE has recently pulled back from local resistance after establishing a new higher high in its ongoing bullish trend. Rather than being a sign of weakness, this rejection is a typical development in trending markets—where a higher low often follows to build momentum for the next leg up.
Looking at the 4H timeframe, price action is currently hovering around a key support zone near the value area high, which aligns closely with the 0.618 Fibonacci retracement level. This area is acting as a technical confluence and could serve as the next potential higher low if PEPE can hold above it on multiple 4-hour candle closes.
A sustained hold at this level would likely trigger a rotation back toward the recent resistance, increasing the probability of a breakout and further continuation to higher levels. The current correction should be viewed as a bullish retest, presenting a possible “buy the dip” opportunity within a strong market structure.
From a technical perspective, as long as PEPE maintains support at this zone, the bullish trend remains intact. Momentum indicators continue to lean in favor of the bulls, and volume behavior remains consistent with prior accumulation phases before impulsive moves.
In summary, PEPE is showing signs of healthy consolidation within a bullish framework. The recent rejection is more likely a setup for continuation rather than reversal. If the support zone holds, the market could soon be eyeing a fresh breakout and a test of higher resistance levels in the sessions ahead.
Double Your Money Top 5 Crypto Coins Looking to double your "pesaa"? 💸 In this video, we break down 5 powerful crypto coins that are gaining momentum in 2025:
👉 INJ (Injective)
👉 ONDO
👉 ORDI
👉 SUI
👉 RUNE (THORChain)
These coins have serious potential for massive growth 📈. Whether you're new to crypto or already investing, this video will help you stay ahead of the curve!
🔔 Subscribe to GURU – Aur Ho Ja Shuru for more insights on crypto, money, and smart investing.
👇 Drop your favorite coin in the comments!
#PesaaDouble #Crypto2025 #INJ #ONDO #ORDI #SUI #RUNE #CryptoUrdu #InvestingTips #CryptoCoins #CryptoNews

PEPE 1D Harmonic Pattern Setting Up for a Bullish Breakout!Hey traders!
I'm spotting a potential bullish setup on #PEPEUSDT — and it’s one worth watching closely.
🔍 Technical Overview:
On the 1D time frame, #PEPE is forming a textbook harmonic pattern — still confirming.
No bearish divergence or reversal signs spotted so far — momentum remains intact.
Key level to watch: B point of the harmonic pattern, acting as strong horizontal resistance.
🎯 Trade Idea:
Plan: Wait for a clean breakout above the B-level, followed by a successful retest.
If the retest holds as support, I’ll be entering a long position with tight risk management.
TP-1: 0.00001292
TP-2: 0.00001647
SL: 0.00000549
⚠️ Why patience matters: Jumping in too early can expose you to fakeouts. Confirmation = confidence!
💬 What do YOU think? Is #PEPE about to explode or will the resistance hold? Drop your thoughts below! 👇
📈 If you find this helpful, don’t forget to: 👍 Like
💬 Comment
🔁 Share
📌 Follow me for more high-probability setups!
Let’s trade smart, not emotional. 💡
#PEPE #CryptoTrading #HarmonicPattern #BreakoutSetup #TechnicalAnalysis #TradingView #CryptoCommunity #Altcoins
