You all Panic and Sell While Whales Buy Ever sold at the exact bottom, just before the bounce?
Mass fear always becomes the perfect entry for whales, while regular traders are running away.
In this post, I’ll break down how their mindset beats ours, and how to flip the script on your own fear.
Hello✌
Spend 3 minutes ⏰ reading this educational material.
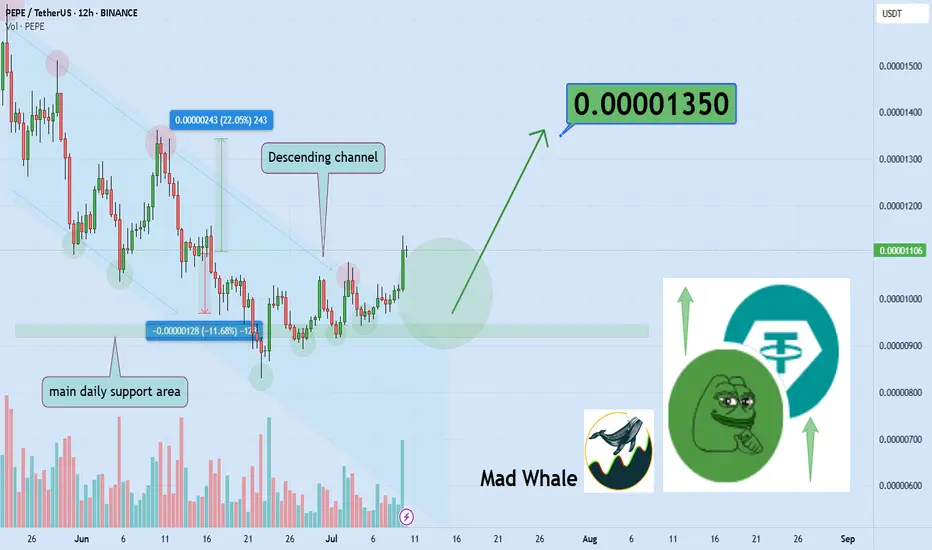
🎯 Analytical Insight on PEPEcoin:
BINANCE:PEPEUSDT has broken above the descending channel resistance as well as a significant daily resistance level, supported by a solid increase in trading volume 📈. This confirms genuine buying interest and momentum in the market. Based on this breakout, I expect at least a 22% upside, with a target near 0.0000135 🚀.
Now , let's dive into the educational section,
🧠 Emotions Lie. The Chart Doesn’t.
In crypto markets, our first reaction is rarely logical. When prices dump, fear kicks in, not analysis.
That’s exactly when the big players step in. They know retail won’t buy the bottom; they chase green candles, not red opportunities.
🐋 What Whales Think That Retail Doesn’t
Whales wait for emotional exhaustion, full-on fear or full-on greed.
They don't enter with the crowd. They enter when the crowd wants out. That’s not coincidence. It’s a setup.
🧨 Self-Sabotage: The Retail Playbook
Retail traders usually:
Sell in panic on the dump
Buy in FOMO on the pump
Quit after liquidation
Whales don’t react to price, they react to opportunity.
📉 Why Real Bottoms Never Feel Safe
When a real bottom forms, it feels terrible. News is negative. Social media screams "SELL."
No one trusts the recovery. That’s why most miss it. Comfort does not equal opportunity.
⏳ Silence and Patience: Whale Superpowers
In sideways markets, retail gets bored and walks away.
Whales? They accumulate silently. They don’t seek confirmation. They seek positioning.
📊 TradingView Tools That Reveal Whale Moves
TradingView isn't just a charting site, it’s a weapon if you know what to look for:
Volume Profile shows zones where the most trading occurred. If price drops but volume remains dense, that’s hidden buying.
OBV (On-Balance Volume) tracks if smart money is loading while price moves slowly.
Combine RSI + MA to spot where sentiment diverges from logic.
Set up your own TradingView layout with these indicators. Use the data, not your gut.
🧲 Is This Crash A Hidden Invitation?
Every major dip asks one quiet question: “Do you still know the game?”
The smart money listens while the rest scream. The market has rhythm, if you hear it, you win.
🛡 Recap
Next time the market’s bleeding red and everyone’s afraid, zoom out.
Don’t listen to your fear, listen to the chart. Let TradingView’s tools be your edge, not just your screen.
✅ Final Thought:
Whales feed on our fear. So next time you're scared, don’t run, observe.
That fear might be your best entry, not your worst exit.
✨ Need a little love!
We pour love into every post your support keeps us inspired! 💛 Don’t be shy, we’d love to hear from you on comments. Big thanks , Mad Whale 🐋
📜Please make sure to do your own research before investing, and review the disclaimer provided at the end of each post.
PEPEUSDT_BBA8F8 trade ideas
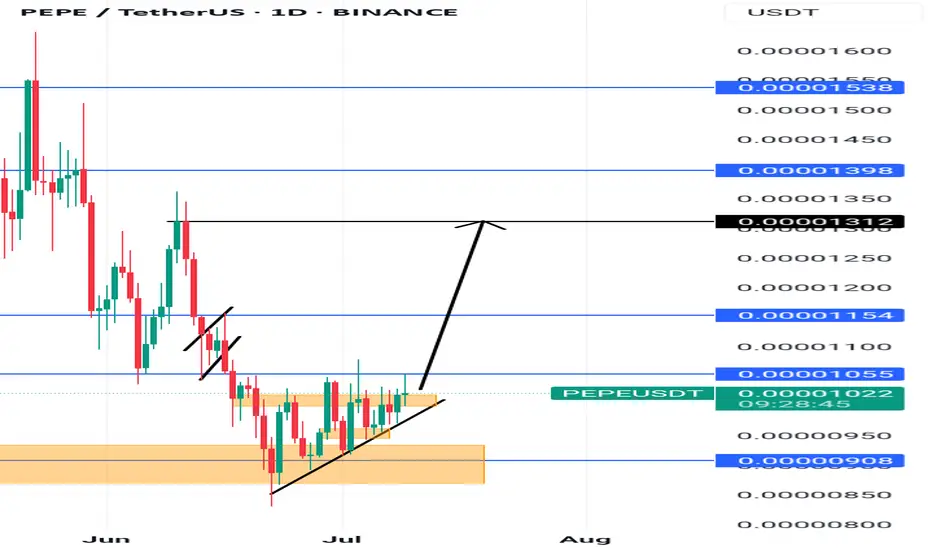
Lingrid | PEPEUSDT Corrective Channel BreakoutThe price perfectly fulfilled my previous idea . BINANCE:PEPEUSDT rebounded powerfully from the 0.00000843 support and broke out of the long-standing downward channel, marking the start of a bullish impulse leg. Price is now holding above the breakout point and consolidating above the 0.00001159 structure, setting the stage for continuation. As long as buyers defend this reclaimed level, price could attempt another leg toward the upper resistance zone at 0.00001500. Structure and volume suggest that accumulation is complete and bulls are in control.
📉 Key Levels
Buy trigger: sustained support above 0.00001159 and breakout follow-through
Buy zone: 0.00001100–0.00001159 (former resistance turned support)
Target: 0.00001500
Invalidation: breakdown below 0.00001100 risks trapping longs
💡 Risks
Volatility around breakout retests may shake weak hands
Failure to reclaim momentum at 0.00001250 could stall the push
Re-entry into the old consolidation range may delay upside momentum
If this idea resonates with you or you have your own opinion, traders, hit the comments. I’m excited to read your thoughts!

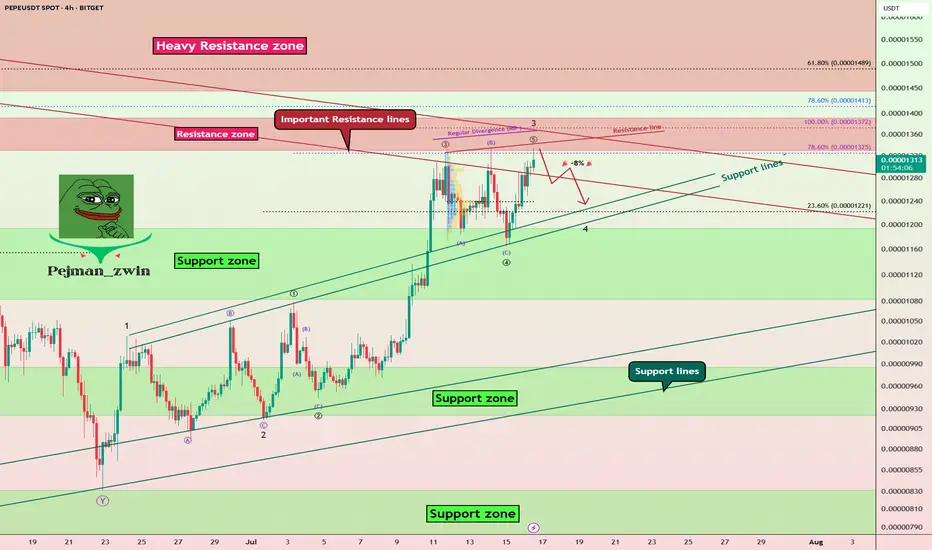
PEPE Faces Key Resistances – Is a -8% Pullback Coming?The PEPE memecoin ( BINANCE:PEPEUSDT ) is currently near the Resistance zone($0.00001392-$0.00001330) and Important Resistance lines . This is the third time that PEPE has attacked the Important Resistance lines .
In terms of Elliott wave theory , it seems that PEPE is completing the microwave 5 of the main wave 3 , so that the main wave 3 is of the extended type .
Also, we can see the Regular Divergence(RD-) between Consecutive Peaks.
I expect a -8% drop for PEPE in the coming hours.
First Target: $0.00001251
Second Target: $0.00001212
Note: Stop Loss(SL)= $0.00001400
Please respect each other's ideas and express them politely if you agree or disagree.
PEPE Analyze (PEPEUSDT), 4-hour time frame.
Be sure to follow the updated ideas.
Do not forget to put a Stop loss for your positions (For every position you want to open).
Please follow your strategy and updates; this is just my Idea, and I will gladly see your ideas in this post.
Please do not forget the ✅' like '✅ button 🙏😊 & Share it with your friends; thanks, and Trade safe.
Is Pepe growing? Read the caption, it's important.Hello friends🙌
✔Some factors caused the price to fall, but in a support area that we have drawn for you with several Fibonacci waves, you can see that a classic double bottom pattern has been formed and buyers have entered.
🔊Now there is no more news of a fall and buyers have raised the price to the point where it has created a higher ceiling and floor, and this is very important and signals a change in trend.
📈Now that the price has broken the specified resistance line and is well supported by the specified support line, we can expect the price to move to the specified areas, but do not forget that the most important thing to observe in trading is capital management⚠
🔥Follow us for more signals🔥
*Trade safely with us*

PEPEUSDT Forming Falling ChannelPEPEUSDT is showing promising signs of a potential breakout, supported by a clear price structure that resembles a falling channel pattern. This technical setup is widely known among traders for indicating a possible trend reversal when the price successfully breaches the channel’s upper resistance line. Coupled with good trading volume, the current market sentiment around PEPE is generating optimism for a potential 60% to 70% gain as buyers step in at these attractive levels.
This crypto pair has caught the attention of both retail and institutional investors due to the growing hype and community-driven momentum behind the PEPE token. Despite its meme origins, PEPE has demonstrated significant staying power in the market, with steady liquidity and regular price swings that attract short-term and swing traders alike. As new investors continue to accumulate positions, the probability of a breakout move increases, reinforcing the bullish outlook.
Technically, the price action indicates that PEPEUSDT may be forming a solid base for an upward surge. The falling channel pattern, if validated with a confirmed breakout and retest, could set the stage for a strong push towards higher levels, aligning perfectly with the projected upside potential. Traders should keep a close eye on the breakout level and volume spikes, as these will serve as key confirmation signals for the next move.
✅ Show your support by hitting the like button and
✅ Leaving a comment below! (What is You opinion about this Coin)
Your feedback and engagement keep me inspired to share more insightful market analysis with you!

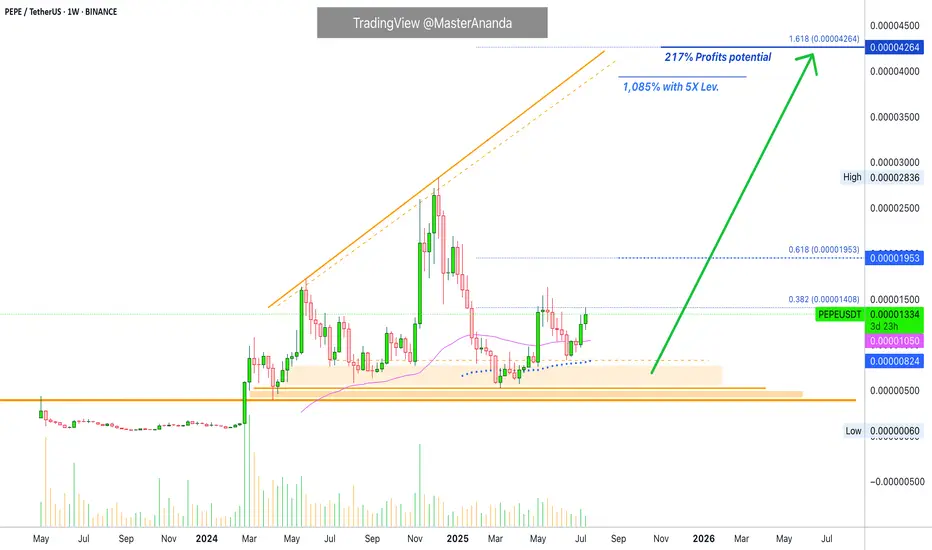
Pepe's Bullish Bias Intensifies · 217% PP = 1085% 5X Lev.The bullish bias for PEPEUSDT is starting to intensify, still early of course. It is still early on this one because the action is still lower than the 19-May high. There are many projects that are already trading above their last high. So it is good news to find a pair that is moving below because we know that soon it will be moving above. In the coming days.
While the 19-May wick high reached 0.00001632, the weekly close happened at 0.00001361. As you can see from the chart, the current price is already higher than the highest weekly close and this gives us a strong bullish signal.
Notice again how the action moved above EMA89 back in mid-April. When the retrace happened, May-June, the recovery happened above this level. A signal of strength.
PEPEUSDT moved briefly below EMA55 only two recover and this is the second week above this level. Trading weekly above EMA55 & EMA89 means that the bullish bias is fully confirmed. A fully confirmed bullish bias means we are set to witness a higher high, and a higher high means prices moving above 0.00001953, short-term. In a matter of days.
The main target for this move is 0.00004264 giving us a nice 217%. With 5X leverage, relatively low risk, that would be beyond 11X (1,085%).
In a matter of days, the entire altcoins market will be bullish and moving higher. Make sure you are fully invested by the time everybody is rushing to buy. That is, you should be all-in now. It is not too late.
Thank you for reading and for your continued support, it is truly appreciated.
Namaste.
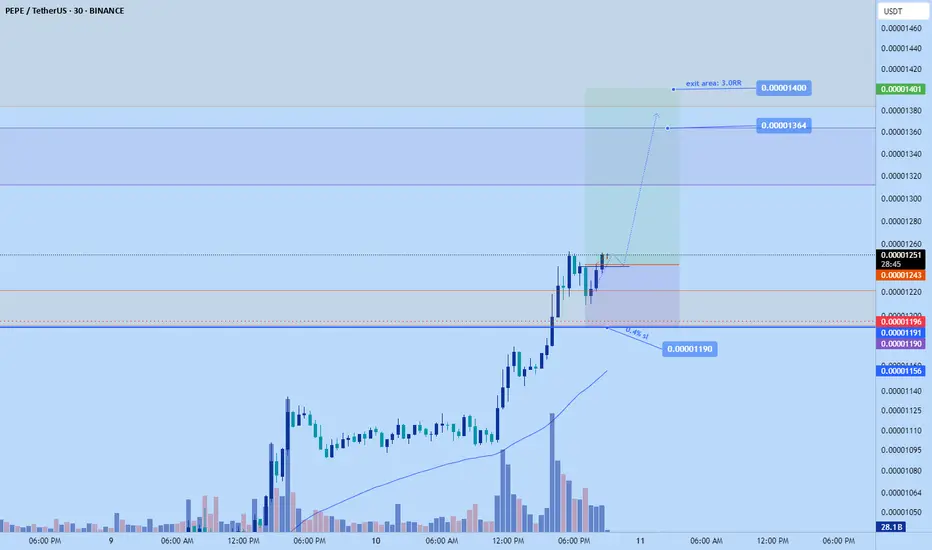
PEPE long to $0.000014Just opened a long position on pepe. Aiming for 0.000014
Stop: $0.00001190
Roughly 3RR
Pepe seems to be itching to breakout and continue pumping based on my DTT analysis. Its high on higher tf though the momentum is strong
Time sensitive
PEPEUSDT high potential pump is cooking As we can see price is near major resistance of 0.000013$ and any breakout here to the upside is going to pump price hard to the targets like 0.000040$.
Two major resistance here is now same which are 0.000013$ which is weekly resistance zone + red trendline resistance also now is here so after breaking this resistance pump is expected and i am looking for heavy pump and even new ATH here.
DISCLAIMER: ((trade based on your own decision))
<<press like👍 if you enjoy💚
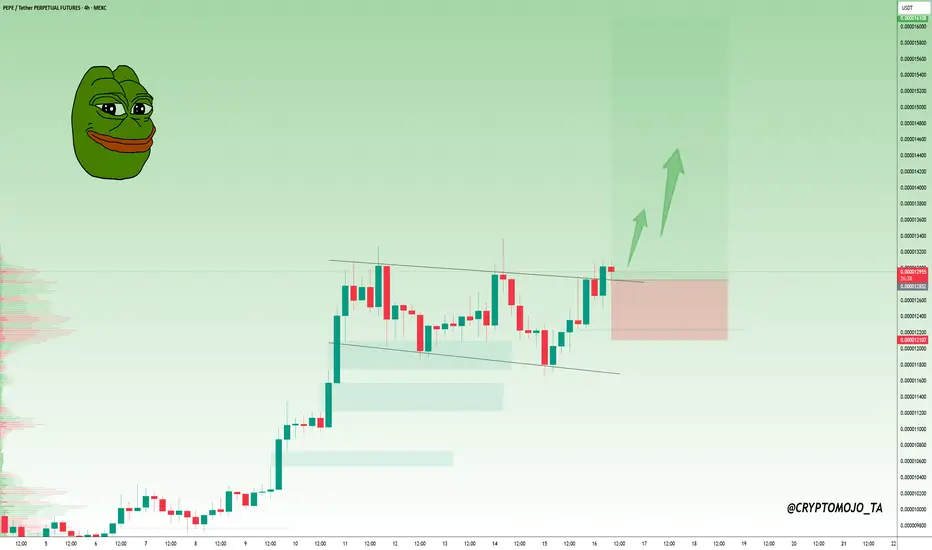
PEPE Breakout Sequence – Double Flag Pattern Forming?PEPE continues its breakout sequence on the 1H chart, forming a classic bull flag followed by another possible setup in real time. The first breakout above 0.00000108 triggered strong follow-through. Now, a second flag is forming just under 0.00000130. With Stoch RSI cooling down, this could be the reset needed for continuation.
📍 Watch for confirmation above 0.00000129 to validate the next leg.
#PEPE #BullFlag #Altcoins #MomentumTrading #QuantTradingPro #CryptoBreakout #TradingView

Pepe usdt updateVery likely scenario, everyone knows that I am a pepe coin hunter and I will return to the previous two charts since 2024 24 Feb

#PEPE:Breakout In Action!#PEPE Breakout In Action 🚀
CRYPTOCAP:PEPE has broken out of the falling wedge on the 4H chart and closed above the trendline.
Price is now retesting the breakout zone, a strong bounce here could push it toward the $0.000016 level (+25%).
Entry: 0.00001285 – 0.00001300
Stop Loss: 0.00001210
Targets:
TP1: 0.00001400
TP2: 0.00001520
TP3: 0.00001580
TP4: 0.00001640
Structure is bullish, watch for continuation after retest📈
DYOR, NFA
PEPEUSD going to moon according to my analysis. {08/june/2025}Educational Analysis says that PEPEUSD may give trend Trading opportunities from this range, according to my technical analysis.
Broker - binance
So, my analysis is based on a top-down approach from weekly to trend range to internal trend range.
So my analysis comprises of two structures: 1) Break of structure on weekly range and 2) Trading Range to fill the remaining fair value gap
Let's see what this pair brings to the table for us in the future.
Please check the comment section to see how this turned out.
DISCLAIMER:-
This is not an entry signal. THIS IS FOR EDUCATIONAL PURPOSES ONLY.
I HAVE NO CONCERNS WITH YOUR PROFIT OR LOSS,
Happy Trading, Fx Dollars.

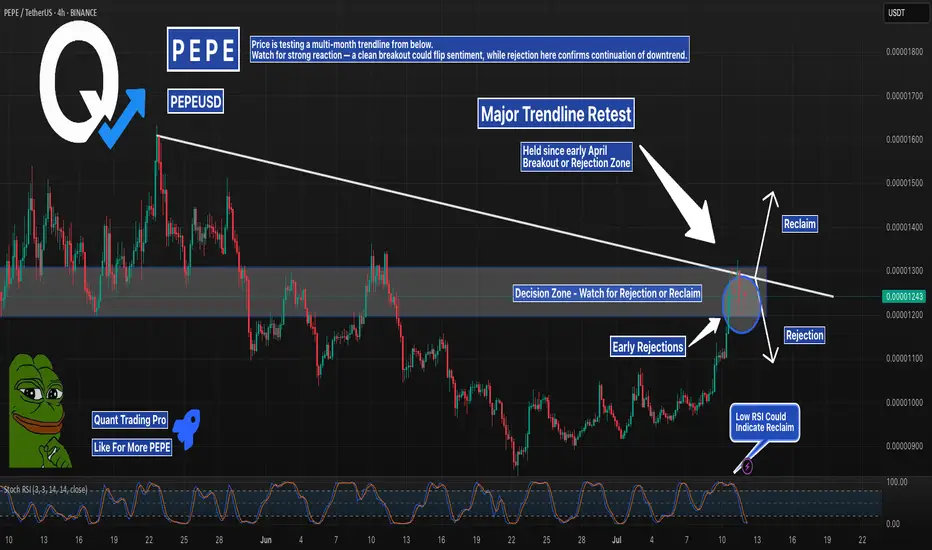
PEPE Trendline Retest – Reclaim Incoming or Final Rejection?PEPE is testing a major descending trendline that has capped price action since early April. After a strong breakout push, price is now consolidating directly under this resistance — inside a tight decision zone.
We’re watching for one of two outcomes:
A reclaim of the trendline + confirmation = potential continuation toward 0.00001350+
A rejection from this level could signal another leg down, continuing the macro bearish trend
🧠 Note: Stoch RSI is reset, hinting that bulls could make another attempt.
📍 Key Levels:
🔼 Reclaim above 0.00001317 = bullish breakout
🔽 Breakdown below 0.00001200 = rejection confirmed
This level will define the next major move.
#PEPE #PEPEUSDT #TrendlineTest #CryptoBreakout #ReclaimSetup #AltcoinWatch #QuantTradingPro #TradingView
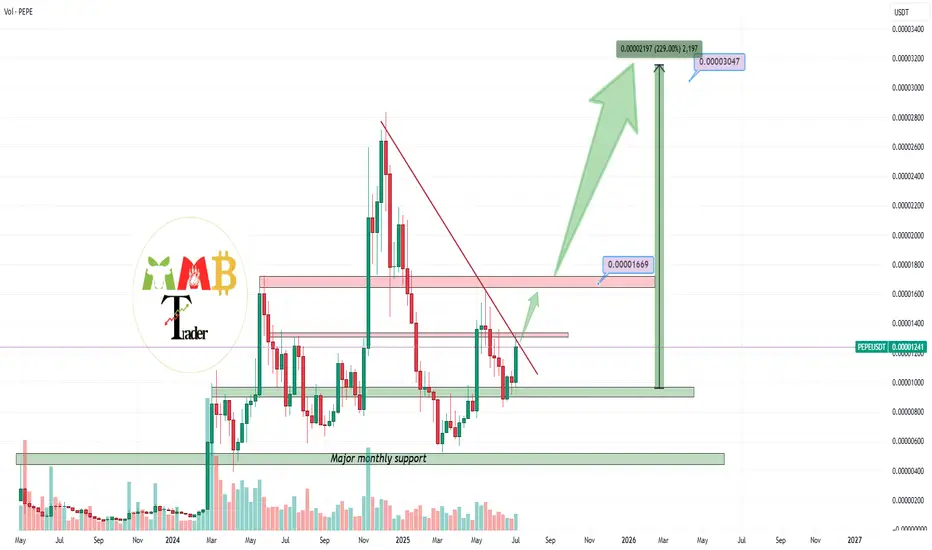
PEPE | On the Way to New HighsPEPE shows a compelling bullish setup following a successful breakout from a descending wedge pattern. The price has broken out and is now positioned for a potential rally toward new highs, as indicated by the upward trajectory arrow.
Key Technical Signals:
- Clean breakout from descending wedge formation
- Strong momentum building after extended consolidation period
- Volume supporting the breakout move
Price Targets:
- First resistance: 0.00001800 (pink resistance zone)
- Extended target: 0.00003500+ (following the projected path)
Risk Considerations:
- Meme coin volatility requires careful position sizing
The technical setup suggests PEPE is well-positioned for a significant upward move, with the breakout confirming renewed buying interest after months of consolidation.

PEPE USDT UPDATE Hi
Very likely scenario, everyone knows that I am a pepe coin hunter and I will return to the previous two charts since 2024 24 Feb

PEPE Breaks Out After Triple Bottom – Retest Incoming?PEPEUSDT just printed a textbook 3-tap support rejection, followed by a Break of Structure (BOS) through the descending trendline — now bulls are watching for a retest entry opportunity.
--Key Technical Highlights:
🔹 3 Rejections @ Support: Price respected the ~$0.00001000 level multiple times, building a strong base.
🔹 Break of Structure (BOS): Momentum shifted as PEPE broke the local highs and pierced descending resistance.
🔹 Wait for Retest: Ideal entry comes on a pullback to the previous resistance for a clean breakout confirmation.
🔹 Target: $0.00001351 – Based on prior swing highs and fib extension levels.
**A failed retest could invalidate the setup — watch lower support (~$0.00000900) for last line of defense.

PEPE – Strongest Setup Among Top Meme Coins
Out of the higher-cap meme coins, I’m leaning more toward $PEPEUSDT.
From a price action perspective, it’s showing more strength than CRYPTOCAP:DOGE , CRYPTOCAP:SHIB , and $WIF. That’s not to say the others won’t pump—but personally, CRYPTOCAP:PEPE looks the most appealing here.
The green box is a solid area to build a position. It’s held the trimester lows well and continues to test them while responding bullishly.
Let’s see how it plays out over the next two months—but I like the odds of upside from here.

PEPEUSDT Critical Decision Zone – Massive Move Incoming?🧠 Macro Technical Analysis
PEPEUSDT is currently hovering within a critical demand zone (0.00000095 – 0.00000110), an area that has historically acted as a strong accumulation base and a launchpad for previous rallies. The chart structure shows multiple interactions with this zone, highlighting its significance as a key inflection level.
This zone is not just a support — it’s a make-or-break battlefield between bulls and bears. Price is consolidating within this zone, setting the stage for a potential explosive breakout or a dangerous breakdown.
🔍 Pattern Breakdown & Key Technical Levels
Accumulation Zone (Yellow Box):
Seen from April 2024 to now, price has bounced several times from this region. The multiple touches and long wicks confirm strong buying interest here.
Sideways Channel / Range-Bound Structure:
Price action between 0.00000110 and 0.00000283 has formed a clear horizontal range, and the current price is once again testing the lower boundary of this range.
Implied Move Projection (Yellow Arrow):
A potential breakout from this range could trigger a measured move to the upside, aiming for the previous high at 0.00000283 — representing a +150% upside potential from current levels.
📈 Bullish Scenario:
1. Price holds above 0.00000100, maintaining structure above demand.
2. Break and daily close above:
0.00000127 (minor resistance)
Then 0.00000140, which could trigger acceleration.
3. Target levels to watch:
🟡 0.00000162 – Intermediate resistance
🟡 0.00000180 – Confluence zone
🟡 0.00000211 – Mid-range mark
🟡 0.00000240 – Major breakout checkpoint
🟡 0.00000283 – Range high and final bullish target
Break above 0.00000283 could open a parabolic rally.
📉 Bearish Scenario:
1. Breakdown below 0.00000095, followed by rejection from the bottom of the demand zone.
2. This could signal:
Weak market structure
Failed accumulation
Invalidation of the bullish setup
Key downside levels:
🔻 0.00000080 – Local support
🔻 0.00000065 – Historical low defense
🔻 0.00000038 – Macro capitulation zone
⚠️ Breakdown from current levels will turn this accumulation into distribution.
🧭 Strategic Takeaway:
PEPE is trading at a decisive zone. A bounce from this level could signal the start of a new bullish phase, while a breakdown could usher in a deeper bearish trend. Traders should closely monitor volume spikes, breakout candles, and confirmations above 0.00000127 to validate bullish momentum.
This is a low-risk, high-reward setup for disciplined traders with proper risk management.
#PEPEUSDT #PEPE #CryptoTechnicalAnalysis #AltcoinBreakout #MemeCoinSeason #CryptoTrading #AccumulationZone #BreakoutAlert #BullishCrypto #BearishScenario

PEPE Pressing Into Its Macro Downtrend — AgainPEPE is back at the same trendline that’s slapped it down twice before — but this third attempt comes with strength.
We’ve got higher lows, reclaimed support, and a solid grind into resistance.
Still, a macro downtrend is a macro downtrend… until it breaks.
This next move will decide if this is the real deal or just another fakeout.
#PEPE #PEPEUSDT #MemeCoinCharts #CryptoAnalysis #TrendlineTest #BacktestEverything #TradingView #QuantTradingPro #CryptoBreakout

W formation Pepe has shifted and invalidated the bearish structure that would have served us a wonderful sell opportunity.
There is a retest, at a support level,once the current candle closes,the movement continues upward all the way to 0.00001312.
PEPE Update on current situationI'll elaborate on updates but I wanted to share a short info about BINANCE:PEPEUSDT and how I see it.
Pepe is currently slightly bellow of the VAH of the range. it fell, again , into the downward channel and goes again (as of now) bellow the VAH. BUT on the left side u can see the high of may/june which functions as a support zone (dotted line) - it already bounced off of it once during december (disregarding the wick deeply into it but that was a flash crash) and hols it so far.
if BTC doesn't f*ck up completely, then PEPE could bounce from that and push towards the POC at 2100 and the VAH at 2500 again. Once a new HH (higher high) from the past lower high is established, it should invalidate the downtrend and find new , stronger support around the POC area and push higher from there.
it all depends on BTC and the market sentiment regarding Trump, Fed, recession etc. but the moment PEPE breaks above again, and I'm certain it will, it'll go for 3000 and up. nobody knows how high it'll still go in this run but I bet it at least will touch 4000 in the next months.

PEPEUSDT – Back Into the Trap Box | Fib Support BelowPEPE is retesting the same high-volume resistance that sparked a selloff in May.
With price pressing into the top box again, this becomes a key decision point.
A breakout sends us higher — but rejection could send price back toward the golden pocket between 0.00001104 and 0.00000979.
Watch the reaction closely.
This is where the next major move begins.
#PEPEUSDT #MemeCoin #SupportResistance #FibRetracement #QuantTradingPro #TradingView

Buy Trade Strategy for PEPE: Riding Meme Culture and Market HypeDescription:
This trading idea focuses on PEPE, a meme-based cryptocurrency that has quickly captured the attention of the crypto community. Inspired by internet culture and designed to harness the viral power of memes, PEPE has benefited from massive online engagement, rapid trading volume growth, and strong community-driven momentum. While it may not offer traditional utility like other tokens, its success lies in speculation, visibility, and the strength of its digital identity — characteristics that have driven short-term rallies in similar tokens like DOGE and SHIBA.
Nonetheless, it's important to understand that meme coins like PEPE are highly speculative and volatile. Their prices are heavily influenced by social media trends, influencer activity, and general market sentiment, rather than long-term fundamentals or real-world utility. Therefore, while potential gains can be attractive, the risks are equally significant and require careful consideration.
Disclaimer:
This trading idea is for educational purposes only and should not be taken as financial advice. Cryptocurrencies — particularly meme coins like PEPE — involve a high level of risk, including the possible loss of your entire investment. Always conduct your own research, evaluate your financial situation, and speak to a licensed financial advisor before making any trading decisions. Past performance is not a guarantee of future results.
