Skeptic | EUR/USD Update: New Triggers Unleashed!Hey everyone, Skeptic here!
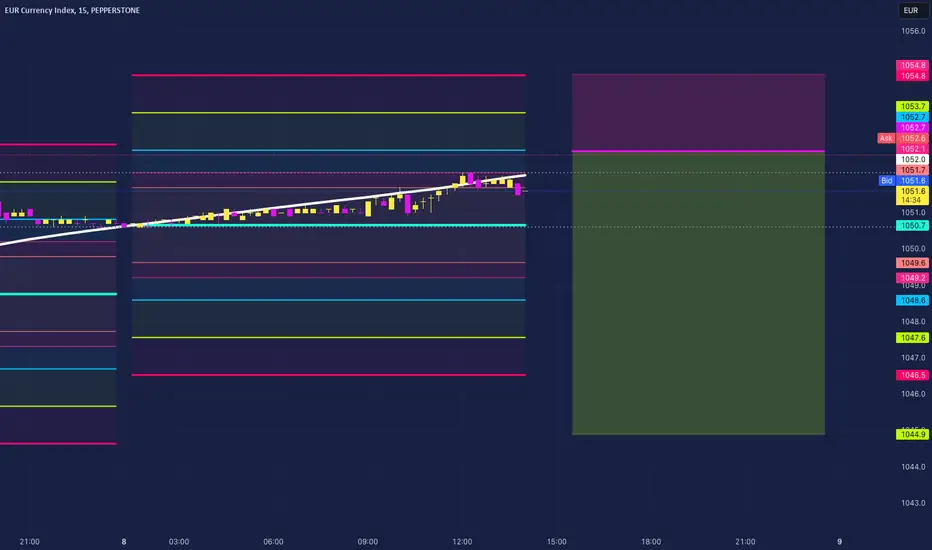
EUR/USD is heating up after EURX consolidated above 1058.8 — a level I highlighted in Sunday’s watchlist — signaling potential longs across EUR pairs. 😎 Let’s break it down with a quick EUR/USD update.
After our trigger at 1.14183 fired, price climbed 33 pips, then pulled back to retest the breakout level. No fakeout this time — that zone is now acting as solid support.
👀 What’s the new trigger?
You've got a few playbook options here depending on your trading style:
Reaction traders: Watch for a strong bullish reaction candle at support.
Momentum traders: Patience pays — wait for an indecision candle to resolve.
Breakout traders: Keep an eye on a clean break above 1.14440.
Shorts? Not yet. Major and minor trends are still bullish, so fading the move isn’t ideal right now.
📝 Quick note: I’m already in a position after the 1.14183 breakout. Still watching EUR/USD closely, especially with DXY nearing a key support at 98.683 — a break there could spark sharp, sustained moves and juicy R/R setups.
As always: No FOMO. No hype. Just reason.
Stay sharp, manage your risk, and let’s grow together! 🤍
💬 Let’s Talk!
If this recap sparked some ideas, give it a quick boost — it helps a lot! Got a pair or setup you want me to break down next? Drop it in the comments. Thanks for sticking around — keep trading smart! ✌️
EURX trade ideas

Forex Market AnalysisUSD with a failed 2D week to go 2-2 rev to the upside and take out pivot highs. This occurs at the same time as the EURO looking weak with the most interesting of the 3 charts. EURO with the potential 2-1-2D week after clearing Motherbar highs two weeks ago and now giving us the actionable signal back through to motherbar lows. Price was stuck in the motherbar range for 8 weeks before taking out highs. Now looking to make a sharp move back through that motherbar range to the lows. YEN with the successful 2-2 rev week that has given us a clear BF if we were to drop to the daily TF. YEN with TFC supporting more upside, and being closer to 2-2 continuation rather than 2-2 rev. Not as interesting as USD and EURO at the moment, but definitely will be noted as I am mainly watching anything EUR/X for downside, and USD/X for upside. Side note: GBP and AUD both bearish weekly's but not as interesting as other currencies right now. Main pairs to watch this week :
Bull:
USD/JPY- (Daily PMG to the upside could be a huge early week mover)
USD/CAD - Daily hammer 2-2 for BF expansion
Bear:
EUR/USD (2-2 Week, Gorgeous weekly BF)
GBP/USD - Weekly 2-2 to the downside. Larger ATR than most others
AUD/HKD - shooter 2-2 Daily, Inside week. Check the Daily BF (Wow)
Neutral:
AUD/CAD - 3-1 Daily and inside week

EUR Index - Outlook for EUR in the Short to Medium Term (2024)
Euro Strength: The EUR has potential for strength in the near term, particularly if the ECB continues its hawkish stance and the US Fed becomes more dovish in 2025. The interest rate differential, coupled with geopolitical stability in Europe, could support the euro.
Risks: Key risks to the euro include renewed geopolitical shocks (especially related to the Russia-Ukraine war or instability in the Mediterranean), weaker-than-expected economic growth in the Eurozone, and further disruptions in global trade.

EURX / DXY 11/11/2024Enjoy it expecting dollar up after retracement and euro down after retracement up


Euro currency index analysisAs we have a kind of double bottom followed by a CHoCH and then a BOS, It seems that we're in a bullish trend right now and as we don't have any divergence in TSI indicator so I think this move is good enough to have a pullback and then come up again to this level.
Let's see what happens...
Please consider the risk management.
Goodluck.

EURX - SHORTWe are looking for shorts on OANDA:EURUSD OANDA:EURJPY FX:EURAUD FX:EURCAD OANDA:EURJPY OANDA:EURCHF OANDA:EURNZD this month.
Obviously, news greatly impacts determining the correct entry, but you should consider the pair's momentum when you are looking for an entry.
I consider 09.05 will see a change of trend on most of the EUR pairs
EUR Currency Index 4HPEPPERSTONE:EURX It seems like it will respect the resistance and possible fall...

Analyzing Euro Index Price Movements and Projecting Future TrendIntroduction:
Understanding the dynamics of the financial market requires a keen eye and a comprehensive analysis of various factors influencing price movements. In this blog, we delve into the recent trends of the Euro Index, particularly focusing on its bullish momentum, subsequent pullbacks, and the potential impact of upcoming events.
Bullish Momentum and Pullbacks:
Throughout the second half of June 2023, the Euro Index exhibited a strong bullish momentum, as evidenced by its consistent upward movement on the 4-hour time frame. This upward trajectory continued until the end of June, indicating a robust market sentiment favoring the Euro. However, markets are seldom a one-way street, and a pullback occurred in the middle of July's first half. This temporary retracement is a normal occurrence and often signifies profit-taking or a slight shift in sentiment.
Fake Break and Change of Character:
Interestingly, as July drew to a close, the Euro Index displayed a curious pattern. A fake break of the previously established structure occurred, suggesting a potential shift in market dynamics. This move may have been a tactic to sweep liquidity resting above previous highs, possibly setting the stage for a change of character in the market. This change could indicate a shift from the previous bullish sentiment to a more cautious or bearish outlook.
Short-Term Pullback and Strong Selling Zone:
To counter any unbalanced price movement within the bearish leg, a short-term pullback took place during the first half of August 2023. This corrective action aimed to stabilize the market and prevent any rapid declines. Notably, a strong selling zone emerged between the price levels of 1045 - 1048, suggesting that these levels could act as significant resistance points for future price movements.
Anticipating Future Trends:
Considering the recent developments and upcoming events, projections for the Euro Index's future movements become intriguing. The expectation is for the Euro Index to continue its descent, potentially reaching around 1025 from its current position at 1043. This projection aligns with the market's current sentiment, characterized by the short-term pullback and the emergence of a strong selling zone.
Impact of Upcoming News:
Adding another layer of complexity to the analysis is the anticipation of major news events scheduled for the last week of August 2023. These events could potentially act as catalysts for significant price movements in the Euro Index. Traders and investors should remain vigilant and stay updated on these news developments, as they could shape the market's direction and further validate the projected trends.
Conclusion:
Analyzing the Euro Index's recent price movements provides valuable insights into market dynamics and potential future trends. From the bullish momentum to the subsequent pullbacks and changes in market character, each phase contributes to the overall narrative of the Euro Index's journey.


EURO index....2h bullish view.-EURO index is testing broken neck line of head and shoulders pattern.
-Next target is the next demand zone.
-Waiting for bouncing off the demand zone for long trade with good R/R ratio after confirmation using the smaller time frames...be safe...

EURX SELL PROJECTION (LAST DROP)The market is currently in a complex correction which carries or bears three wave structure (WXY waves). As we see, wave X is about to be completed on only if the red line gets broken below. The last wave which is the wave Y is set to carry three sub waves with the 5-3-5 formation of its sub waves.
COMPLEX CORRECTION - WXY
WAVE W - 5 WAVES
WAVE X - 3 WAVES OR TRAINGLE
WAVE Y - 3 WAVES

Be on the lookout for EUR pairs these next few weeksAs we can see the EURX is currently in range. The weather is calm, cool and collected hence we shall expect a storm.
What's your take on the EURX?

Be on the lookout for EUR pairs these next few weeksLooks like a clean H&S pattern has formed, indicating that price will now plummet to the downside. Therefore, My bias for most of the EUR pairs is bearish.

j.Hejazi | EURO index Sell Signal WatchThe price attempted a false break out of the ascending wedge and was rejected by the yearly resistance at 1033, leading to a downward move. A divergence is evident on the MACD indicator. In order to consider a sell signal, we need to wait for the price to break down to 1025.5
----------------------
Let me know your thoughts in the comments, and show your support by liking the idea.
Please follow if you're interested in more ideas like this.
Your support is greatly appreciated!

EUR crashEUR index has formed a channel heading up to a supply zone. The supply zone has been touched, so we can expect a huge move going down.

EurxHello friends . have a nice day The market needs a growth, I think it will be formed in the dark range of this growth

EURX IdeaOn daily view, i think Euro will go down for a while then price will push up to make a new high.

EUR Index Analysis EUR Index Analysis
As you see in daily chart, down wave 5 from wave c is done and we are in up impulse wave.
Regards,

EUR-INDEX READY TO PUSH HIGHER ON ECB-RATE HIKE.
- EUR-Index looks ready to seek higher ground
- Pivot-perspective is a run from Weekly PP to Weekly R2
- With Dollar still pretty strong other CCY(s) have to facilitate the move
- Prime candidate is GBP
- This should translate in EURGBP running JUN & JULY '22 highs
.

Bearish then a major reversal on EUROEUR will complete its uncompleted bearish sequence before reversal... This means most EURXXX pairs will sell before reversing.. #DYOR and follow me for more

