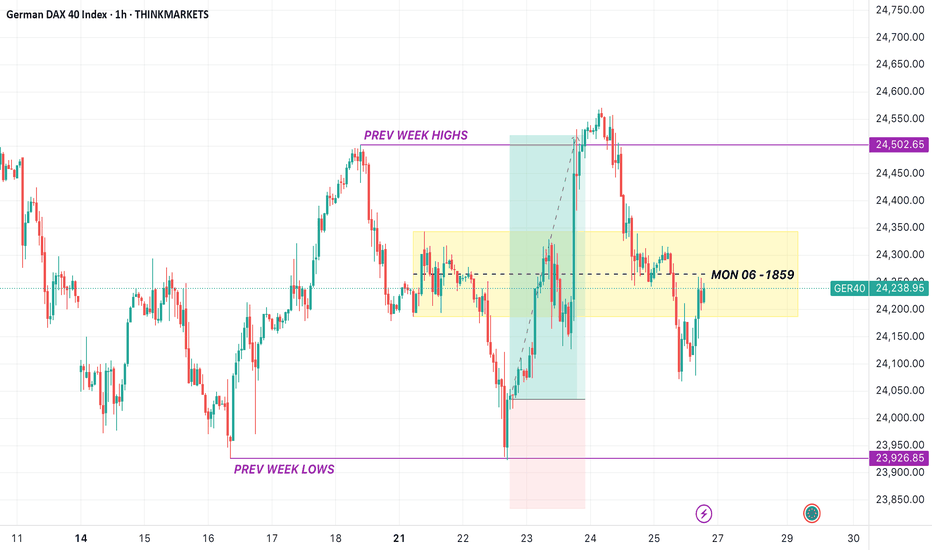
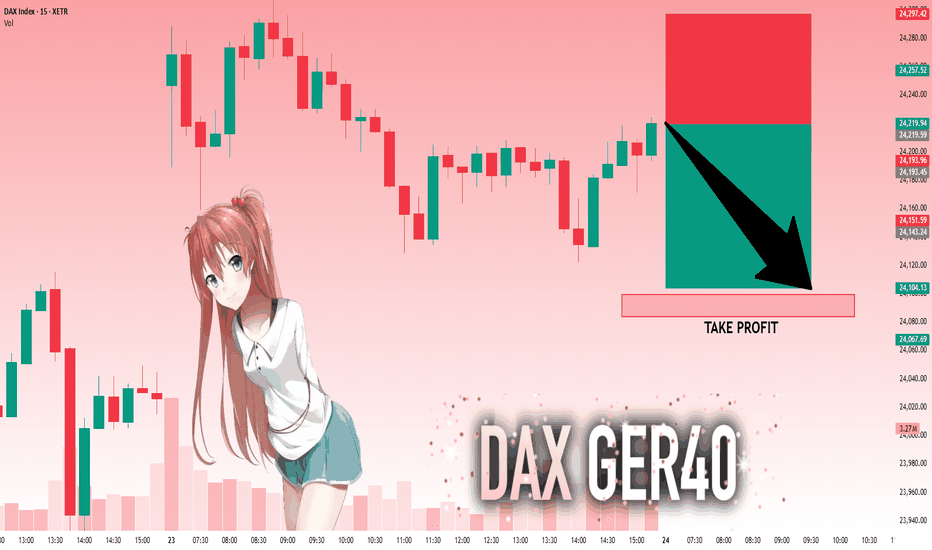
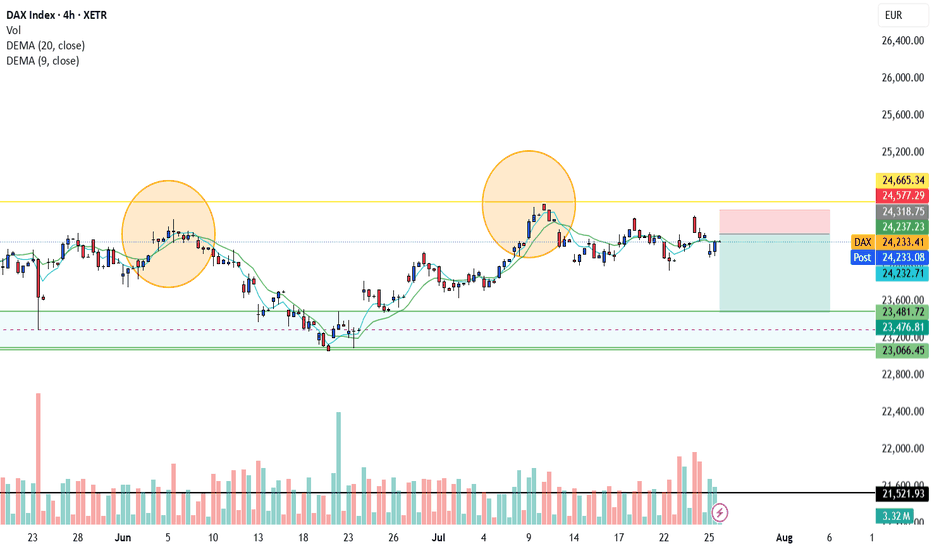
DAX40 - TIME TO KILL THE DAX/GERTeam, we have been patiently waiting for the pump of DAX time to short the DAX at 20845-60, STOP LOSS AT 20960 TARGET 1 AT 20796-82 = TAKE PARTIAL and bring stop loss to BE TARGET 2 AT 20650-65 TARGET 3 AT 20360-450Shortby ActiveTraderRoom4
DAX - Slight correction - short term trade, before we move up?Hi guys, not much to be said, the DAX has been perfoming amazingly the past few weeks, looking to catch a short term selling trade. Entry: 20,883 Target 20,550 As always my friends happy trading! P.S. If you have questions or inquiries about one of my existing set-ups or personal questions / 1 on 1 sessions consider joining my community so you can follow up with me in private!Shortby DG55Capital3
DAX BULLISH BREAKOUT|LONG| ✅DAX is trading in an uptrend And we are seeing a strong Bullish breakout of the key Horizontal level of 20,500 So we are bullish biased And we will be expecting A further bullish move up LONG🚀 ✅Like and subscribe to never miss a new idea!✅ Longby ProSignalsFx112
Ger30 trading planHi traders expect a pull back on ger30,you can see a clear breakout without a proper retest,according to my opinion we need a retest to atleast 20600 to 20400 in order to find proper entries to those who didn't manage to take it from the start,you might get a chance to position yourselfs,am just trying to spot quickly trend for coming weeks for both indices,trade responsible. Longby mulaudzimpho1
DAX 40 Patience pays off. Price reacted strongly off my 4H support zone and Order Block as well as dynamic support of my 4H trendline, Price then moves bullish, breaking resistance and now officially supportLongby addiv18601
Small pullback and potential bearish confirmation Dax managed to touch 20500, but pushed down as it is around 20000 or 19800 region. The price may push to retest the 20300, 20400, and 20500 marks and if it rejects with stability under any of the highs, it may fall down as a potential bearish confirmation. If the price action declines from the top, a possible range and target can be between the highs and possibly 19620. However, establishing above 20500 may see a continued upside outcome. Failure to find a small pullback from 20000 and 19800 may also lead to the downward trajectory.Shortby Two4One4Updated 2
DE40 "German DAX 40" Indices Market Bullish Heist Plan🌟Hi! Hola! Ola! Bonjour! Hallo!🌟 Dear Money Makers & Robbers, 🤑 💰 Based on 🔥Thief Trading style technical and fundamental analysis🔥, here is our master plan to heist the DE40 "Germany 40" Indices market. Please adhere to the strategy I've outlined in the chart, which emphasizes long entry. Our aim is the high-risk Red Zone. Risky level, overbought market, consolidation, trend reversal, trap at the level where traders and bearish robbers are stronger. Be wealthy and safe trade.💪🏆🎉 Entry 📈 : You can enter a Bull trade at any point, however I advise placing Buy limit orders within a 15 or 30 minute timeframe. Entry from the most recent or closest low or high level should be in retest. Stop Loss 🛑: Using the 4h period, the recent / nearest low or high level. Goal 🎯: 20,800 (or) escape Before the Target. Scalpers, take note 👀 : only scalp on the Long side. If you have a lot of money, you can go straight away; if not, you can join swing traders and carry out the robbery plan. Use trailing SL to safeguard your money 💰. Warning⚠️ : Our heist strategy is incompatible with Fundamental Analysis news 📰 🗞️. We'll wreck our plan by smashing the Stop Loss 🚫🚏. Avoid entering the market right after the news release. Fundamental Outlook 📰🗞️ The DE40 (German DAX 40) index is expected to move in a bullish trend. Here's a breakdown of the analysis: Reasons for Bullish Trend: Strong Economic Growth: Germany's economy is expected to continue growing, driven by strong consumer spending and investment. Low Unemployment: Unemployment rates in Germany are at historic lows, which is expected to support consumer spending and economic growth. Positive Earnings: Many German companies are expected to report positive earnings, which could boost investor sentiment and drive the index higher. Monetary Policy: The European Central Bank (ECB) is expected to maintain its accommodative monetary policy, which could support the economy and drive the index higher. Fundamental Analysis: GDP Growth Rate: 1.5% - 2.0% expected for Q4 Inflation Rate: 1.2% - 1.5% expected for January Unemployment Rate: 3.2% - 3.5% expected for January Earnings Growth: 5% - 7% expected for Q4 Please note that this is a general analysis and not personalized investment advice. It's essential to consider your own risk tolerance and market analysis before making any investment decisions. Take advantage of the target and get away 🎯 Swing Traders Please reserve the half amount of money and watch for the next dynamic level or order block breakout. Once it is resolved, we can go on to the next new target in our heist plan. Keep in mind that these factors can change rapidly, and it's essential to stay up-to-date with market developments and adjust your analysis accordingly. 💖Supporting our robbery plan will enable us to effortlessly make and steal money 💰💵 Tell your friends, Colleagues and family to follow, like, and share. Boost the strength of our robbery team. Every day in this market make money with ease by using the Thief Trading Style.🏆💪🤝❤️🎉🚀 I'll see you soon with another heist plan, so stay tuned 🫂Longby Thief_TraderUpdated 2
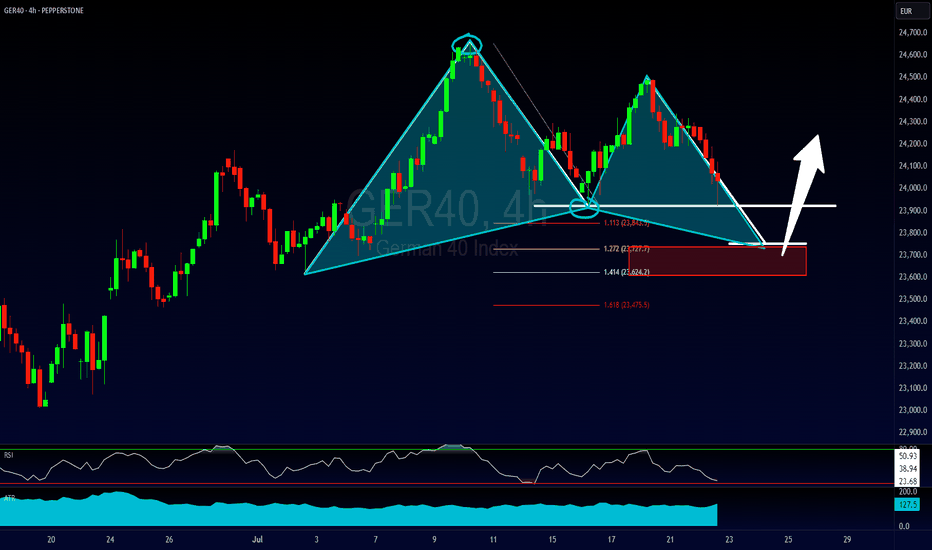
Confluence of Bearish Gartley 222 and Head & Shoulders When I saw this I believed it was a powerful confluence but up to until now it seems the market has other ideas. Its a head and shoulders at the top with a gartley 222 butterfly pattern. these patterns have only managed to produce further accumulation with no significant drops. It looks like my confluence will fail. Trade what you see and practise sound money management.Shortby ChasuraGold225
Moustafa! Dax towards 19420 as TP1 07.01.25* We are in front of a golden chance to short it from its peak!! * Broke the uptrend line on the daily frame * It will return back to the huge rising wedge which it broke through before and caused that huge bullish wave * If it will go to TP2 it means that it will fill the daily gap which was not filled since long time ago! ***Note My ideas are exclusive to myself only and is not regarded as an advice for traders or investors and are not more than personal thoughts which I just wanted to share with you all and I do hope they could help. I am not selling any signals and I do not take money favour any trades recommendations. They are free of charge all lifelong but I keep the copy rights of them though to not be copied or shared or sold.Shortby moustafa_mareiUpdated 115
dax reversaltop of channel can be top for this year. daily and weekly RSI confirmed that winter is coming Shortby fafanina049
de30 We start a new year with de30 The general trend is up and the goals are very big Please be patient Keep calm in the buying positions and take profits with each step or invest in the medium term as the market is still upLongby Indicators1MGGROUPUpdated 2
DAX / GER40 analysisThe PEPPERSTONE:GER40 XETR:DAX has exhibited a consistent bullish trend in recent months, trading within an ascending channel on the weekly chart. However, on the daily chart, signs of exhaustion are emerging following significant upward moves, suggesting a potential short-term consolidation or correction. Support and Resistance Levels: Resistance 1: 20,261 points Resistance 2: 20,481 points Support 1: 19,202 points Support 2: 19,028 points The daily RSI is hovering near the overbought zone, indicating the asset may be overvalued and vulnerable to a correction. A potential distribution phase is noted, where institutional players might be taking profits after the recent rally, setting the stage for a possible reversal or sideways movement. Relevant Fundamental Factors: The German economy faces significant headwinds, with growth projected at just 0.1% for 2025 following two years of contraction. Additionally, the recent political crisis, marked by the collapse of the governing coalition, has heightened economic and political uncertainty in the country. Possible Scenarios: Bullish Scenario: If the price breaks above the 20,261-point resistance with strong volume, it could target the next resistance at 20,481 points. To confirm the continuation of the uptrend, the RSI must remain at moderate levels, avoiding extreme overbought conditions. Bearish Scenario: If the price breaches the 19,202-point support, it may accelerate toward the next support at 19,028 points or even the discount area. A declining RSI would reinforce this scenario, signaling increased selling pressure.by JoaoZarateUpdated 323228
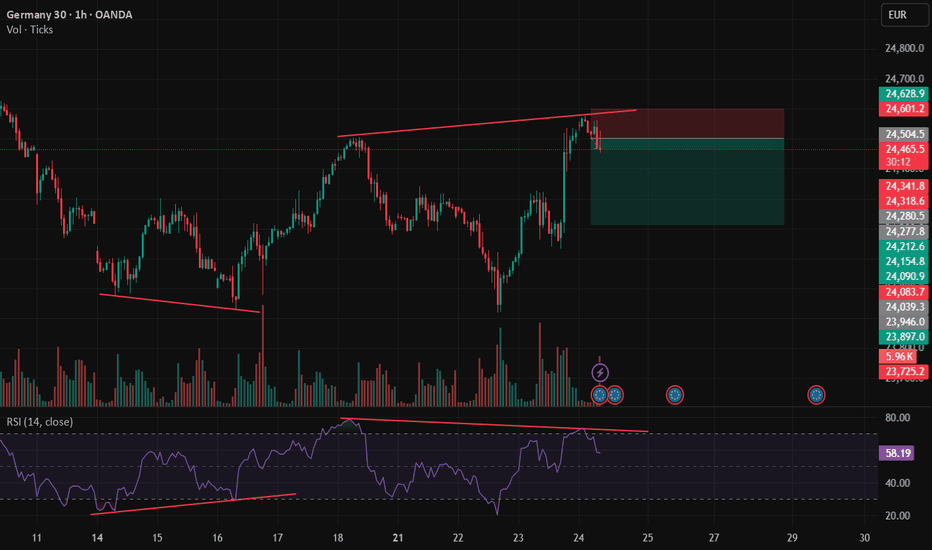
German Index DE40/DE30 Analysis - January 13, 2025German Index DE40/DE30 Analysis - January 13, 2025 Today, we’ll discuss the German Index (DE40/DE30) on a 30-minute time frame. Currently, the momentum remains bullish, and the price recently tapped into a significant resistance zone at 20,191. However, following this interaction with the resistance, there are indications of bearish momentum forming, which could signal a potential move to the downside. Logical Analysis and Predictions: Resistance Interaction: OANDA:DE30EUR The level of 20,191 has historically acted as a strong resistance, which often leads to retracements. The initial rejection observed suggests the possibility of a bearish correction. Expected Downside Targets: The first potential target is 19,950, where the price could pause briefly as it interacts with this minor support level. A stronger downside move could take the price to 19,761 or even as low as 19,750, aligning with a key support zone. Confirmation of Downside Momentum: Before taking any position, conduct multi-timeframe analysis. Watch for a change of character (CHoCH) or a break of structure (BOS) on the 30-minute or lower time frames, confirming a bearish bias. Ensure the trade setup provides a low drawdown by identifying precise entry points with clear stop-loss levels. Risk Management and Reminder: Trading is reactive, not predictive. This analysis provides a possible scenario, but it’s crucial to validate with your own strategy and methodology. Protecting your capital is more important than chasing profits. This concludes today's analysis. Trade smart, use proper risk-to-reward ratios, and we’ll see you in the next update.Shortby KainT212
Perfect buy entry in Germen-30 base on ict conceptPerfect buy entry in Germen-30 base on ict concept * day order block * order block inside weekly fvg * market left above double equal liquidity. Longby mnr246824681
4-hr German40: 400 Points Drop, If a Key Support Fails The German DAX 40 has formed a Double Top, a classic bearish signal, triggering a 300-point drop. The RSI points downward, indicating strong selling pressure, but remains above oversold territory, suggesting further downside potential. The broader international stock market sell-off supports this bearish outlook. The Golden Cross pattern has been invalidated by the prevailing downward momentum. Immediate support is found at the 23% Fibonacci retracement near 20,090, which aligns with the 60-period MA, forming a critical level. If this support fails, a deeper decline towards 19,600 is highly probable. This zone coincides with the 50% Fibonacci retracement, a key level that acted as a reversal point in December. For sellers, 19,600 serves as a strong target for take-profit, given its technical significance and historical relevance.Shortby Trendsharks4
DAX/GER - time for LONGTeam, DAX price at 20179 we should enter slowly at 20182-20172 tight stop loss at 20154 or extend to 20135 Target 1 at 20215-20236 Target 2 at 20252-20283 NOTE: Once the price hits the 1st target range, take partial and bring stop loss to BE. The real market opens in an hour, and some support should be available. The consumer price index is coming out in a few hours. Longby ActiveTraderRoom2
#202502 - priceactiontds - weekly update - daxGood Evening and I hope you are well. comment: Neutral. Big bull wedge or ascending triangle (does not matter which way you see it, both are correct) on the daily chart and we are in the middle of it. I do have a heavy bearish bias for dax but since we only printed 2 bear bars for the past 11 trading days, it’s not useful to be bearish. I do think it’s more likely we see 20100 and the top is in but I don’t expect US indexes to go down much more next week, so having a bearish bias might not be the most useful thing. We can’t expect the bull trend line to break on the next hit, given the recent bullishness, so my base assumption is a week inside the triangle and more chop. current market cycle: Bull trend or trading range. Only a daily close below 19600 would be my confirmation for the trading range. key levels: small range for next week is 20000 - 20500 and big range for Q1 is 19400 - 20500 bull case: Bulls are still in control but have only seen rejections above 20400. They probably want to buy closer to the bull trend line and daily ema before they try another run at the ath 20522. We are close enough to it, that it’s possible we make another ath but the upside is most likely very limited. Bulls got their retest of the ath and made a lower high, all bullish targets are met and the retest-gods are pleased. Market is free to do whatever. Invalidation is below 19600. bear case: Bears kept shorting new highs and made money but they have not going much for them until they can break below the current bull wedge/triangle. As much as I want this to crash to 19000, bears are weak. Best outcome for next week would be if we stay below 20400 and close the week at or below 20000. Invalidation is above 20550. short term: Neutral. No interest in buying this and will continue to scale in and out of shorts. I would like to see 20000 next week. medium-long term from 2024-12-22: Any short near 20000 is reasonable if you can hold for another 1000 points higher. 17000 is much more likely than 21000 though. My first target for the next months is 19000, followed by 17700ish and ultimately down to 16000-16300 in 2025. current swing trade: Continuing with scaling in and out of shorts. Currently holding a position with entry 20424 on futures (135 points above xetra). chart update: Added bear gap and still having my preferred path down as a two legged correction down to 19000.by priceactiontds114
DAX H4 | Approaching all-time highDAX (GER30) is rising towards a multi-swing-high resistance and could potentially reverse off this level to drop lower. Sell entry is at 20,510.80 which is a multi-swing-high resistance. Stop loss is at 20,800.00 which is a level that sits above the 127.2% Fibonacci extension. Take profit is at 20,013.22 which is an overlap support that aligns close to the 61.8% Fibonacci retracement level. High Risk Investment Warning Trading Forex/CFDs on margin carries a high level of risk and may not be suitable for all investors. Leverage can work against you. Stratos Markets Limited (www.fxcm.com): CFDs are complex instruments and come with a high risk of losing money rapidly due to leverage. 64% of retail investor accounts lose money when trading CFDs with this provider. You should consider whether you understand how CFDs work and whether you can afford to take the high risk of losing your money. Stratos Europe Ltd (www.fxcm.com): CFDs are complex instruments and come with a high risk of losing money rapidly due to leverage. 66% of retail investor accounts lose money when trading CFDs with this provider. You should consider whether you understand how CFDs work and whether you can afford to take the high risk of losing your money. Stratos Trading Pty. Limited (www.fxcm.com): Trading FX/CFDs carries significant risks. FXCM AU (AFSL 309763), please read the Financial Services Guide, Product Disclosure Statement, Target Market Determination and Terms of Business at www.fxcm.com Stratos Global LLC (www.fxcm.com): Losses can exceed deposits. Please be advised that the information presented on TradingView is provided to FXCM (‘Company’, ‘we’) by a third-party provider (‘TFA Global Pte Ltd’). Please be reminded that you are solely responsible for the trading decisions on your account. There is a very high degree of risk involved in trading. Any information and/or content is intended entirely for research, educational and informational purposes only and does not constitute investment or consultation advice or investment strategy. The information is not tailored to the investment needs of any specific person and therefore does not involve a consideration of any of the investment objectives, financial situation or needs of any viewer that may receive it. Kindly also note that past performance is not a reliable indicator of future results. Actual results may differ materially from those anticipated in forward-looking or past performance statements. We assume no liability as to the accuracy or completeness of any of the information and/or content provided herein and the Company cannot be held responsible for any omission, mistake nor for any loss or damage including without limitation to any loss of profit which may arise from reliance on any information supplied by TFA Global Pte Ltd. The speaker(s) is neither an employee, agent nor representative of FXCM and is therefore acting independently. The opinions given are their own, constitute general market commentary, and do not constitute the opinion or advice of FXCM or any form of personal or investment advice. FXCM neither endorses nor guarantees offerings of third-party speakers, nor is FXCM responsible for the content, veracity or opinions of third-party speakers, presenters or participants.Short02:28by FXCM10
Technical Analysis for GER40 (DAX) for January 13-17Overall Trend : On the daily chart, PEPPERSTONE:GER40 ( XETR:DAX ) has been exhibiting a bullish trend, operating within an ascending channel. We are currently at the 50% mark of the ascending channel, a point of indecision at the moment, as signs of exhaustion are observed following significant upward movements, suggesting a potential short-term consolidation or correction down to 20,005 if the support area is breached. Support and Resistance Levels: Resistance 1: 20,872 points Resistance 2: 20,474 points Support Area 1: 20,077 - 20,198 points Support 2: 20,005 points Chart Patterns and Technical Indicators: Candlestick Patterns: Recently, indecision patterns such as dojis have formed on the daily chart, indicating a possible reversal or consolidation. RSI (Relative Strength Index): The daily RSI is near the overbought zone, suggesting that the asset may be overvalued and subject to a correction. Wyckoff Analysis: A potential distribution phase is observed, where major players might be taking profits after the recent rally, preparing the market for a possible reversal or sideways movement. Relevant Fundamental Factors: The German economy faces significant challenges, with a growth forecast of only 0.1% in 2025 after two years of contraction. Additionally, the recent political crisis has resulted in the collapse of the governing coalition, increasing economic and political uncertainty in the country. Possible Scenarios: Bullish Scenario: If the price breaks above the 50% mark of the ascending channel with significant volume, it may target the next resistance at 20,474 points. To confirm the continuation of the bullish trend, it is important for the RSI to remain at moderate levels, avoiding the extreme overbought zone. Bearish Scenario: If the price loses the support area, it may accelerate the decline towards the next support at 20,005 points. A descending RSI would reinforce this scenario, indicating increased selling pressure. by JoaoZarate114
DAX H4 | Bullish bounce off overlap support?DAX (GER30) is falling towards an overlap support and could potentially bounce off this level to climb higher. Buy entry is at 20,069.07 which is an overlap support that aligns with the 50.0% Fibonacci retracement level. Stop loss is at 19,800.00 which is a level that lies underneath a pullback support and the 78.6% Fibonacci retracement level. Take profit is at 20,418.50 which is a multi-swing-high resistance. High Risk Investment Warning Trading Forex/CFDs on margin carries a high level of risk and may not be suitable for all investors. Leverage can work against you. Stratos Markets Limited (www.fxcm.com): CFDs are complex instruments and come with a high risk of losing money rapidly due to leverage. 64% of retail investor accounts lose money when trading CFDs with this provider. You should consider whether you understand how CFDs work and whether you can afford to take the high risk of losing your money. Stratos Europe Ltd (www.fxcm.com): CFDs are complex instruments and come with a high risk of losing money rapidly due to leverage. 66% of retail investor accounts lose money when trading CFDs with this provider. You should consider whether you understand how CFDs work and whether you can afford to take the high risk of losing your money. Stratos Trading Pty. Limited (www.fxcm.com): Trading FX/CFDs carries significant risks. FXCM AU (AFSL 309763), please read the Financial Services Guide, Product Disclosure Statement, Target Market Determination and Terms of Business at www.fxcm.com Stratos Global LLC (www.fxcm.com): Losses can exceed deposits. Please be advised that the information presented on TradingView is provided to FXCM (‘Company’, ‘we’) by a third-party provider (‘TFA Global Pte Ltd’). Please be reminded that you are solely responsible for the trading decisions on your account. There is a very high degree of risk involved in trading. Any information and/or content is intended entirely for research, educational and informational purposes only and does not constitute investment or consultation advice or investment strategy. The information is not tailored to the investment needs of any specific person and therefore does not involve a consideration of any of the investment objectives, financial situation or needs of any viewer that may receive it. Kindly also note that past performance is not a reliable indicator of future results. Actual results may differ materially from those anticipated in forward-looking or past performance statements. We assume no liability as to the accuracy or completeness of any of the information and/or content provided herein and the Company cannot be held responsible for any omission, mistake nor for any loss or damage including without limitation to any loss of profit which may arise from reliance on any information supplied by TFA Global Pte Ltd. The speaker(s) is neither an employee, agent nor representative of FXCM and is therefore acting independently. The opinions given are their own, constitute general market commentary, and do not constitute the opinion or advice of FXCM or any form of personal or investment advice. FXCM neither endorses nor guarantees offerings of third-party speakers, nor is FXCM responsible for the content, veracity or opinions of third-party speakers, presenters or participants.Long02:29by FXCM1
GER30We looking for selling opportunities as the market has broken outside the bullish momentum resulting in a change of trend leading to sells to the downside| 1H TIMEFRAME Shortby officialpotego_fx1
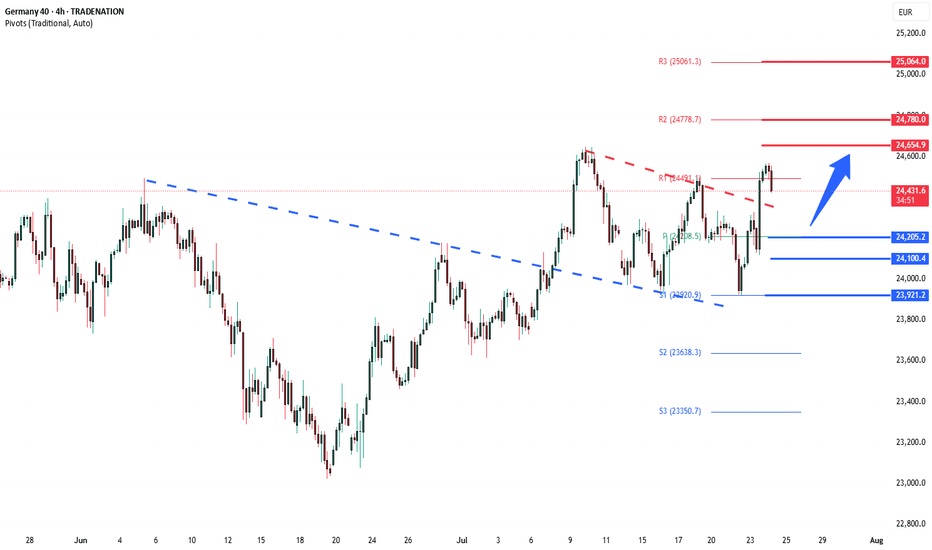
Falling towards 50% Fibonacci support?DAX40 (DE40) is falling towards the pivot which has been identified as a pullback support and could bounce to the 1st resistance. Pivot: 20,103.77 1st Support: 19,782.76 1st Resistance: 20,493.34 Risk Warning: Trading Forex and CFDs carries a high level of risk to your capital and you should only trade with money you can afford to lose. Trading Forex and CFDs may not be suitable for all investors, so please ensure that you fully understand the risks involved and seek independent advice if necessary. Disclaimer: The above opinions given constitute general market commentary, and do not constitute the opinion or advice of IC Markets or any form of personal or investment advice. Any opinions, news, research, analyses, prices, other information, or links to third-party sites contained on this website are provided on an "as-is" basis, are intended only to be informative, is not an advice nor a recommendation, nor research, or a record of our trading prices, or an offer of, or solicitation for a transaction in any financial instrument and thus should not be treated as such. The information provided does not involve any specific investment objectives, financial situation and needs of any specific person who may receive it. Please be aware, that past performance is not a reliable indicator of future performance and/or results. Past Performance or Forward-looking scenarios based upon the reasonable beliefs of the third-party provider are not a guarantee of future performance. Actual results may differ materially from those anticipated in forward-looking or past performance statements. IC Markets makes no representation or warranty and assumes no liability as to the accuracy or completeness of the information provided, nor any loss arising from any investment based on a recommendation, forecast or any information supplied by any third-party. Longby ICmarkets7